Optimizing, publishing, and styling Vector data
Styling vector data
We can style vectorial datasets by adding rules to the default style.
Go to the
Mainrddataset details page and click onEdit > Edit Style > Visual editorWe can add a new rule by clicking on the desired symbol type in the toolbar
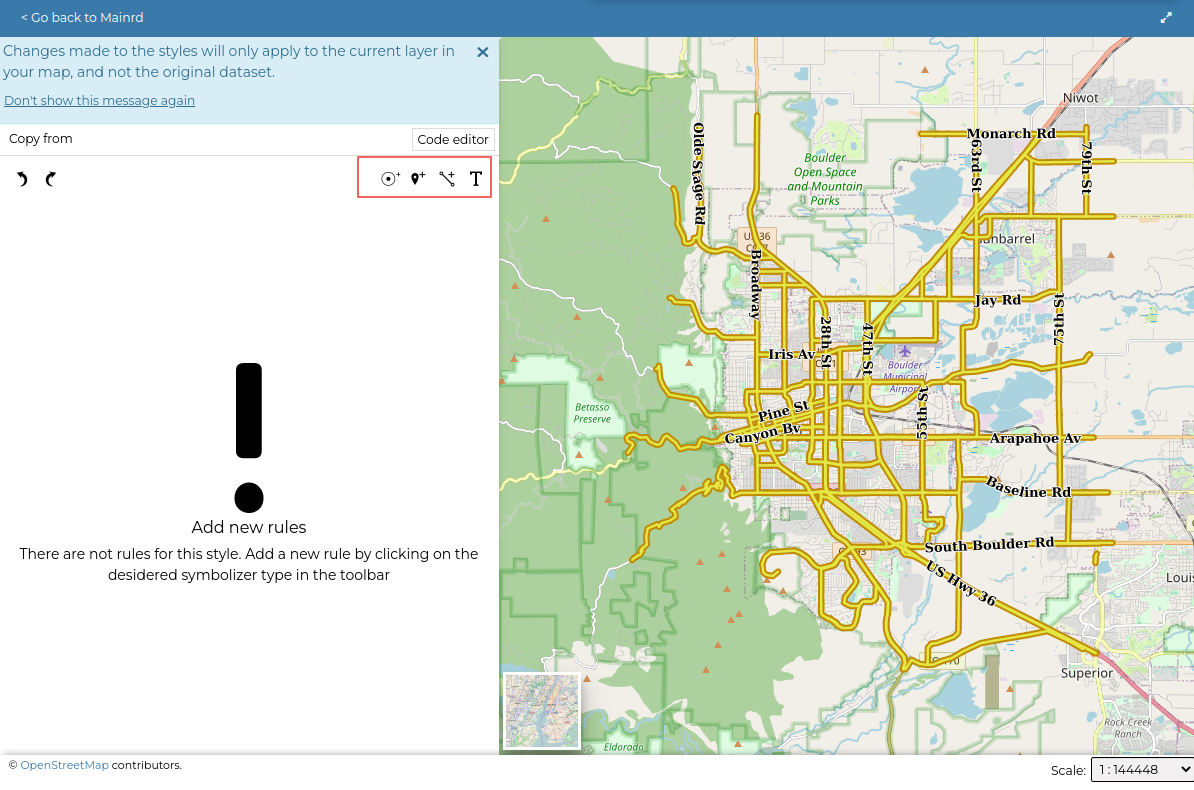
We can also add a rule by copying from previously defined styles using the
copy fromlink.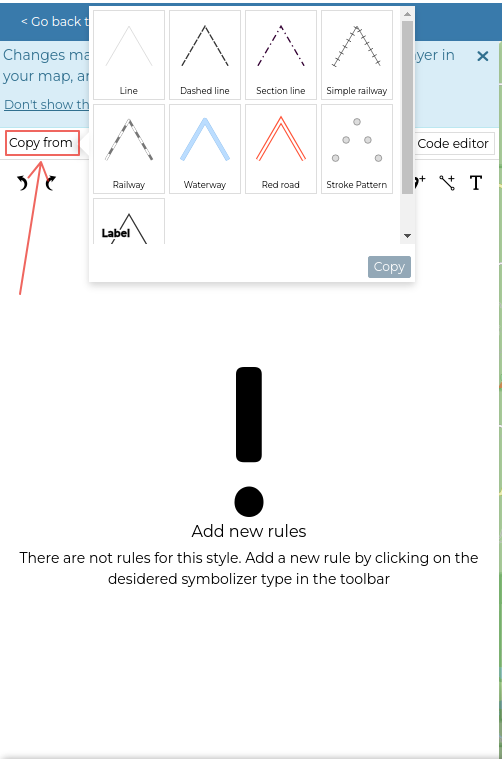
Creating line rule
Click on
 in the toolbar
Name it
CSS Roadsand set the following attributesstroke colour: orange,stroke width: 6,line cap: round,
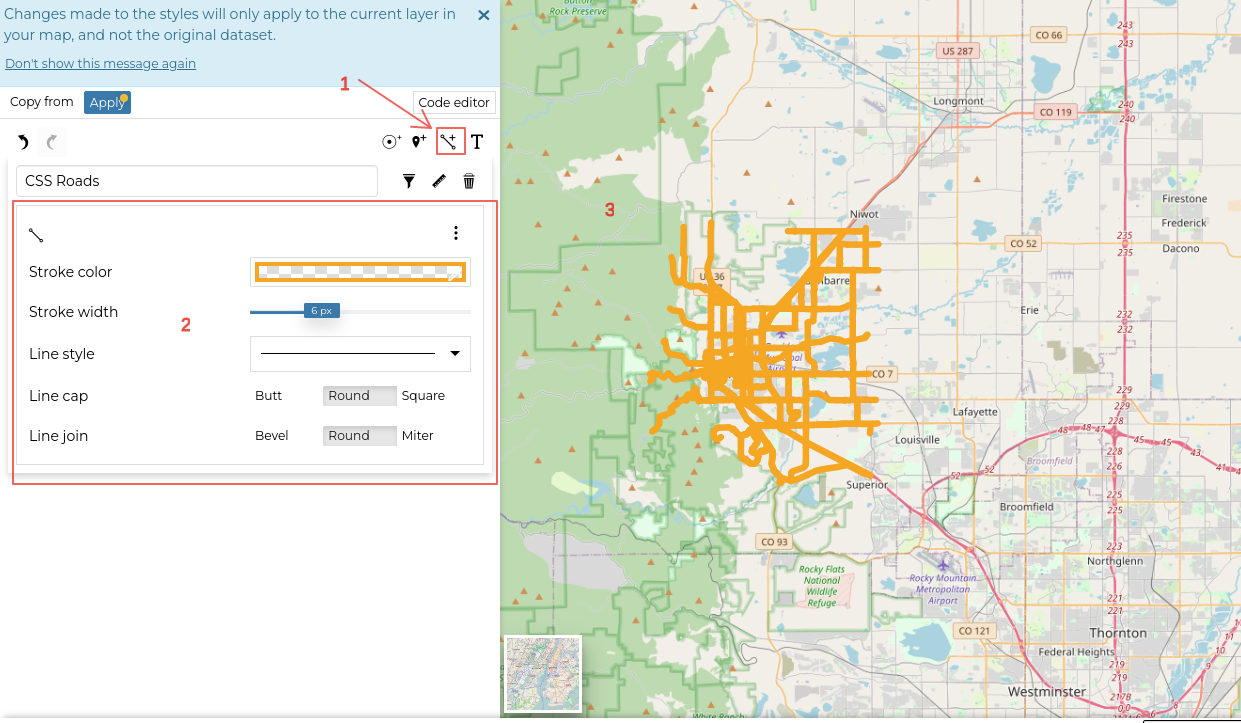
You can also adjust the line rule styles by going through the options listed in the
drop-down-menuin the upper right corner of the menu. See the figure below: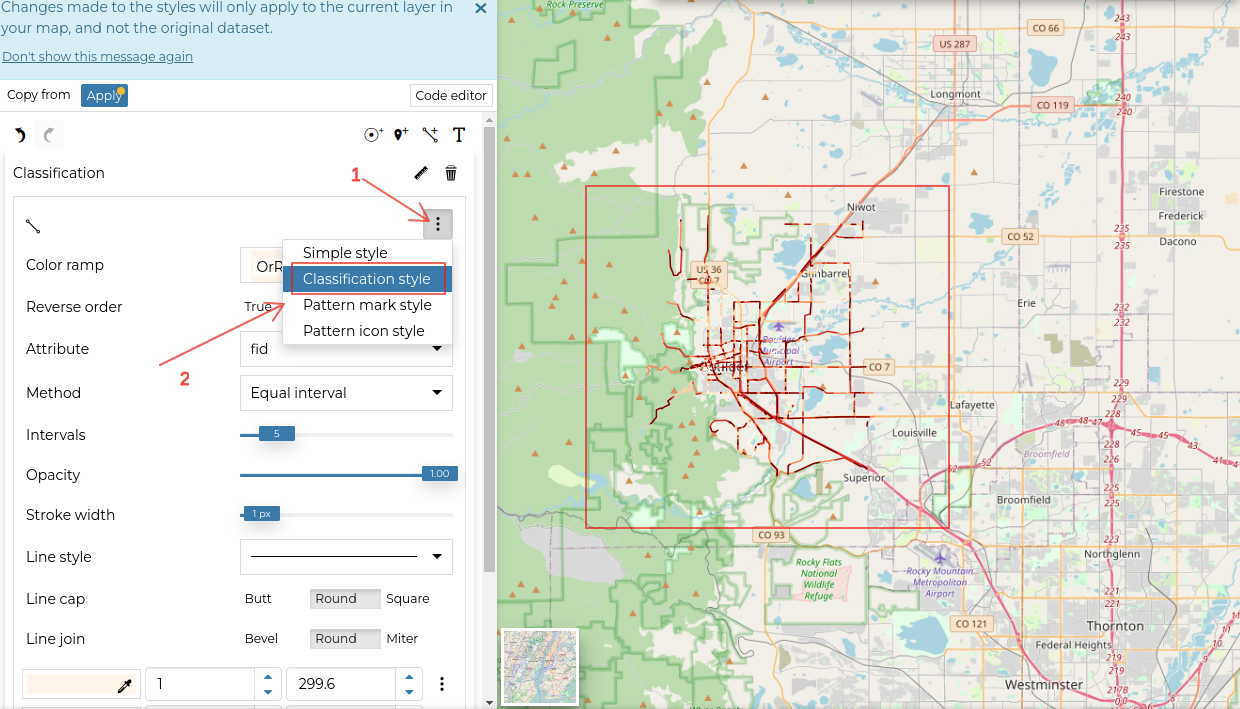
Creating mark rule
Click on
 in the toolbar.
Name it
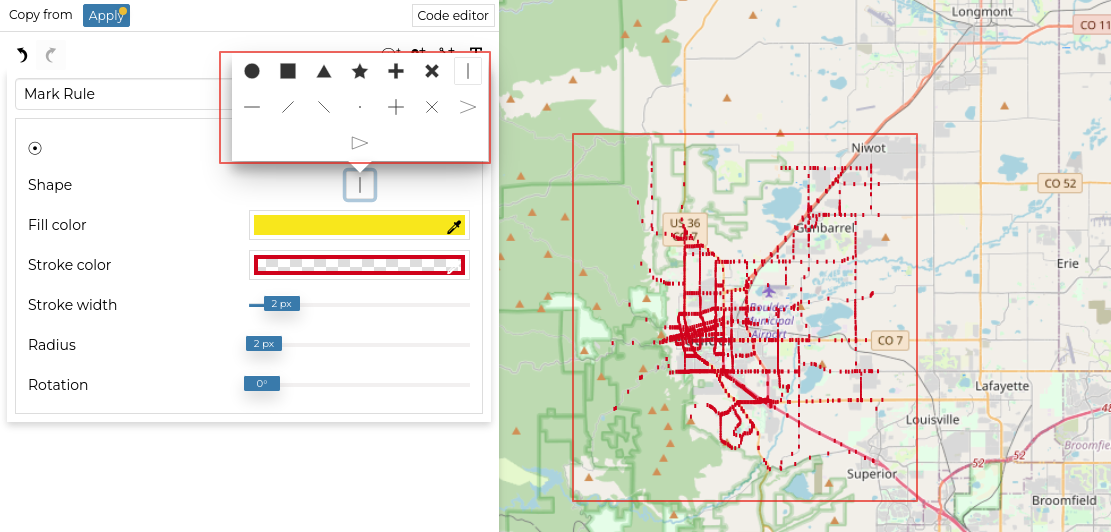
Mark ruleand set the following attributesfill color: yellow,stroke color: red,stroke width: 1,radius: 2,
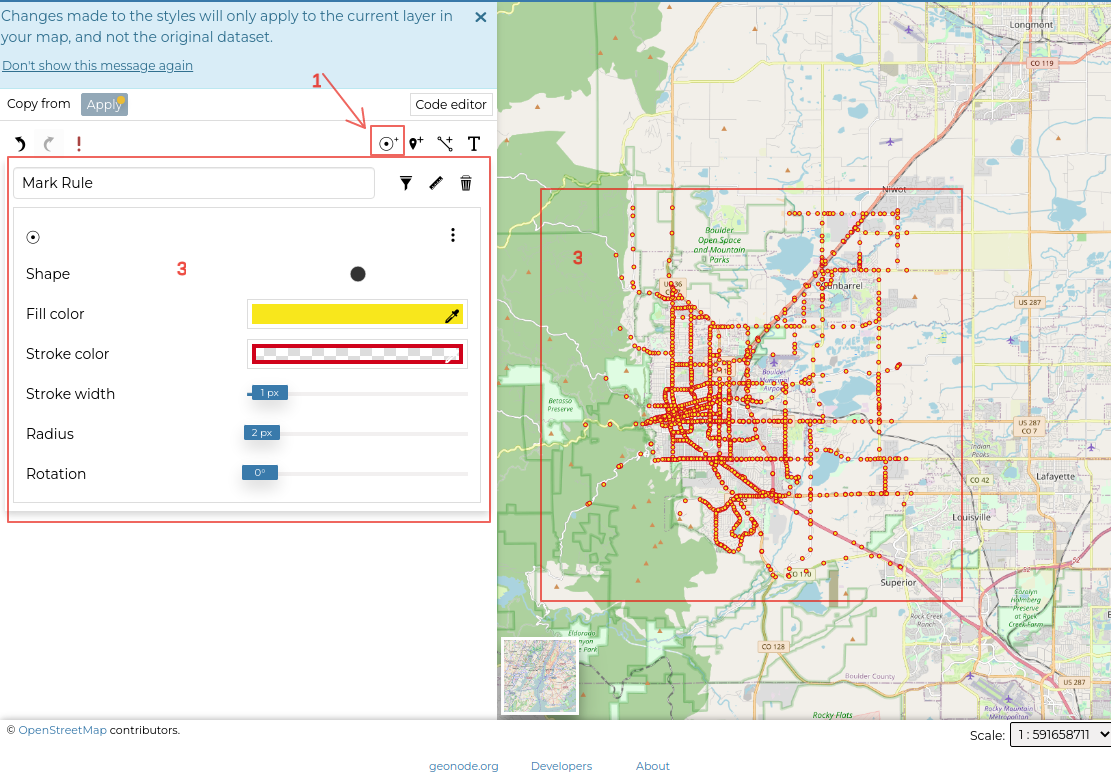
You can also choose another shape by clicking on the shape button to display available options.
Creating text rule
Click on
 on the toolbar.
Name it
Text ruleand set the listed attributes. Select the label from the available attributes.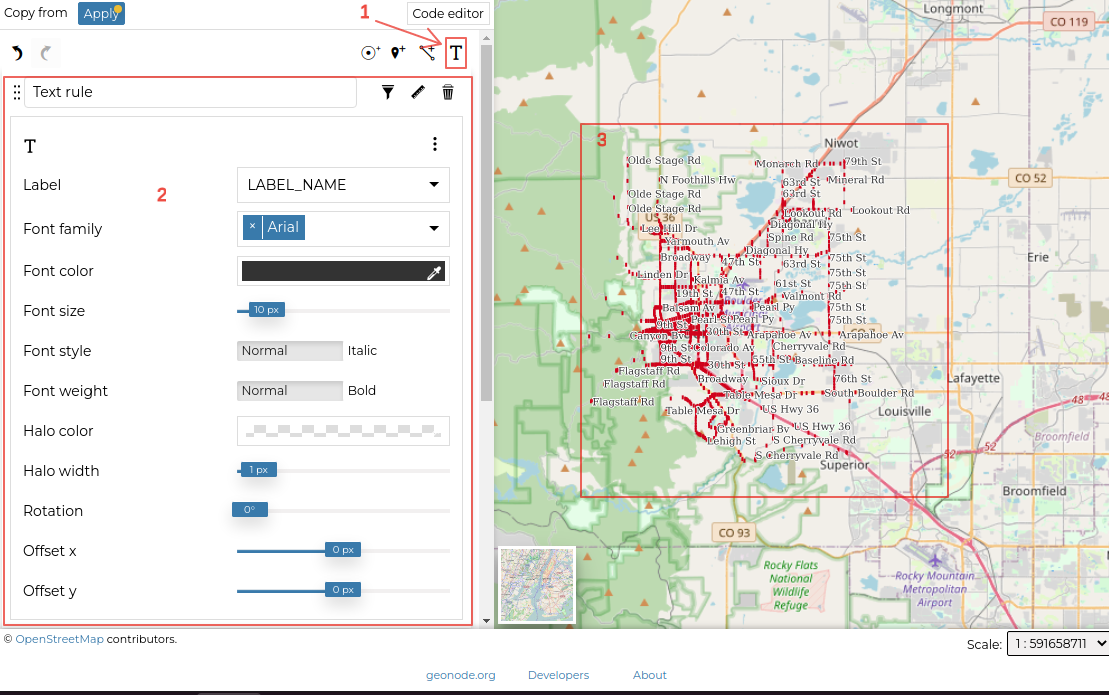
Do the same for the icon rule ![]() .
.
Once you are done adding your rules, click on
Applyto save the changes.