Adding our first Dashboard
A Dashboard is a space where a user can add many miniature items (such as charts, maps, tables, texts, and counters) and can create connections between them to provide an overview for better visualization of the data. A user can also interact spatially and analytically with the data by creating connections between maps and charts, and/or perform analysis for better decisions.
Add the world dataset and create a simple map
Like in previous upload datasets steps, follow the path to /opt/data/sample_data/pretty_maps/data and upload the shapefile with name ne_50m_admin_0_countries. Edit the style to be classified by Map Colour. Once the layer is uploaded create a simple map by clicking on the Add Resource button and create a map as per the map tutorial.
Create a Dashboard
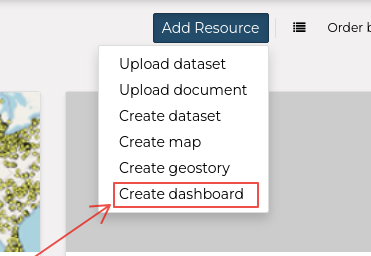
From the
Add Resourcedropdown menu, selectCreate dashboard
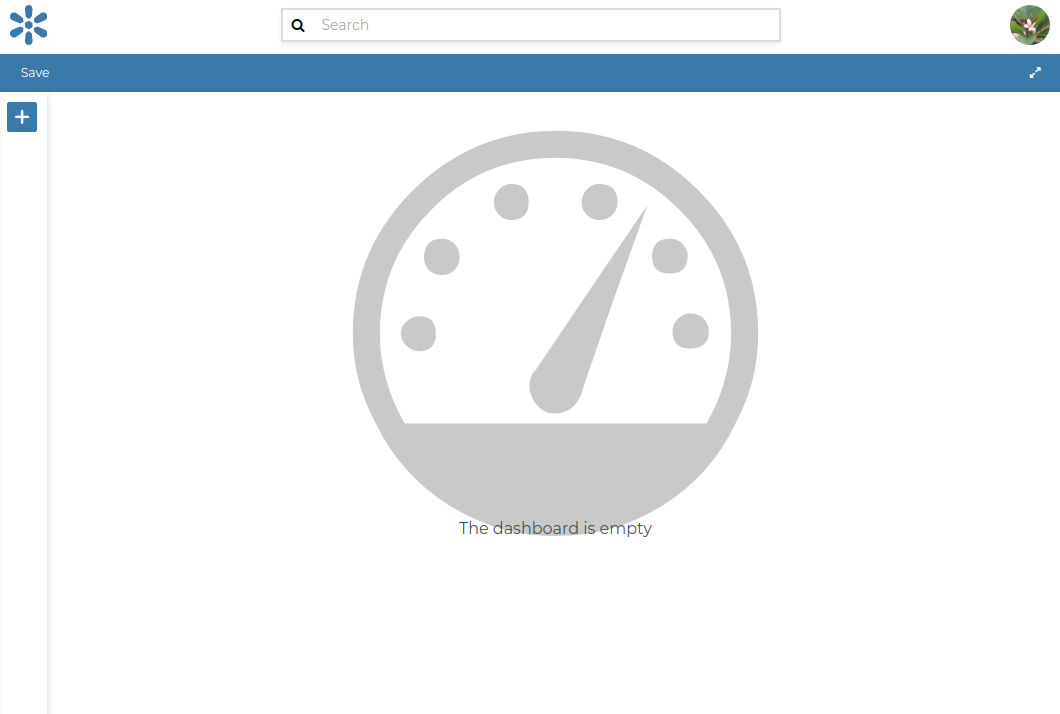
You will be presented with an empty dashboard page ready to be populated.
Click on the Add icon
 to add new widgets.
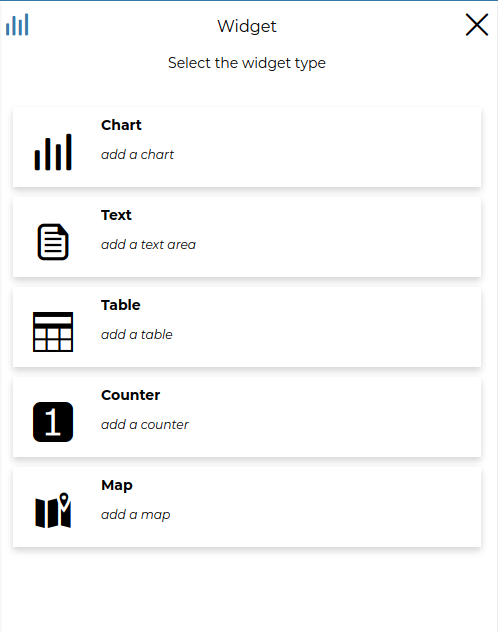
The
Widgetpage will open on the left showing a list of items that can be created and added to the dashboard.
Add map widget
Let’s add our first widget to our dashboard, the
Mapwidget typeClick the
Mapwidget button and you’ll be redirected to a list of existing GeoNode maps. Choose our previously createdWorld Populationmap and click the right arrow to add this to our dashboard.
Once added, you can configure some map options, such as disabling/enabling the info tool
 or add other datasets to the existing map using the plus
  button.
For now, let’s just proceed without changing the map options by clicking the right arrow button again
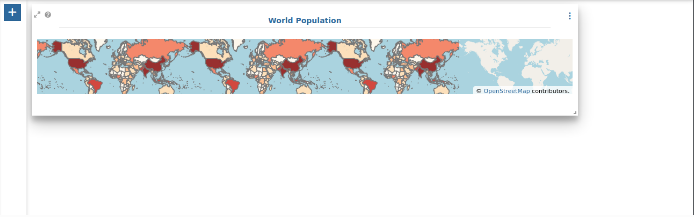
On the last step for creating the
Mapdashboard widget you are asked to provide aTitleand aDescriptionfor your widget. Add some relevant information there, as below:
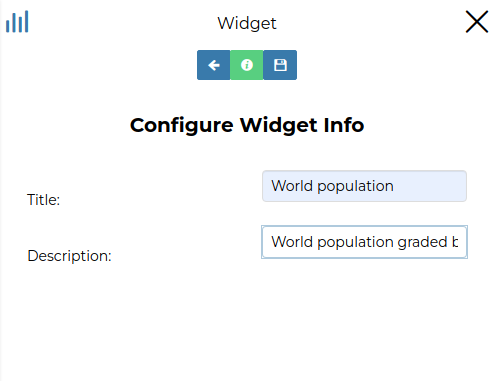
Finally, save it using the floppy disk button

Now we can see our
Mapwidget on our dashboard. Resize the widget so that it covers most of the area of your dashboard. Just leave some space at the bottom and to the right of the dashboard canvas area as shown below:
Add table widget
At the bottom of our dashboard canvas, we will include another type of widget, the
Tablewidget type.Again, click on the add widget button
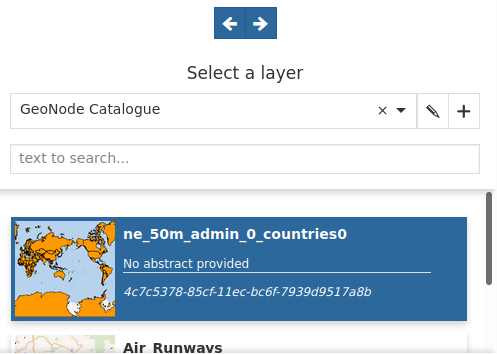
to add one more widget to our dashboard.From the widget list, select the
Tablewidget type.Once selected, you will be redirected to the GeoNode’s list of available datasets. If you did not previously rename our world population dataset, choose the dataset
ne_50m_admin_0_countries0dataset from the list.
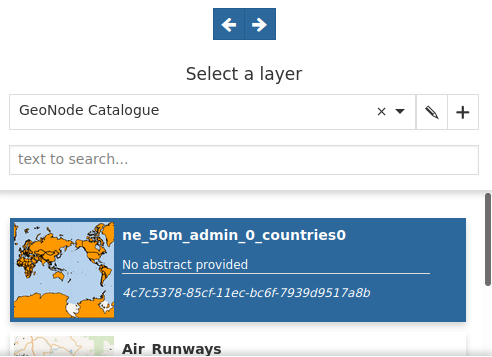
Once selected, click the right arrow button
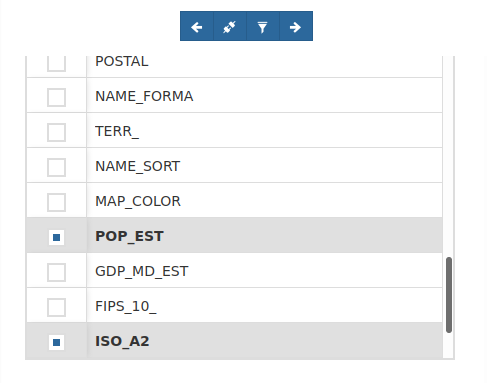
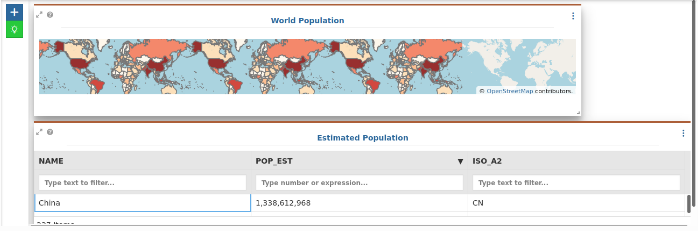
to proceed.In the next step you will be asked which fields you want to show on the dashboard table widget. In this case, we will only choose fields,
NAME,POP_EST, andISO_A2
Before proceeding, please also enable the
connect widgetbutton by clicking on it.
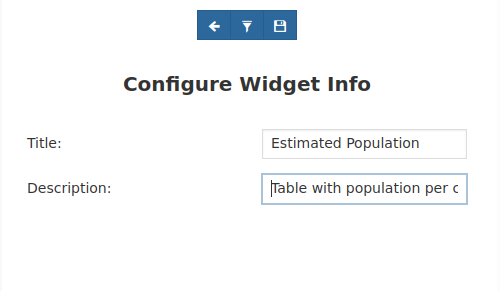
Once again, in the last step, we’ll need to provide a title and description for our widget.
At the end, click the floppy disk symbol save button
to save and add the widget to our dashboard.Place it at the bottom of our dashboard and change the width of it to cover all of the bottom area.
Add legend widget
Next, we will add a legend widget to our dashboard to make the map color classes more readable.
Click on the plus button
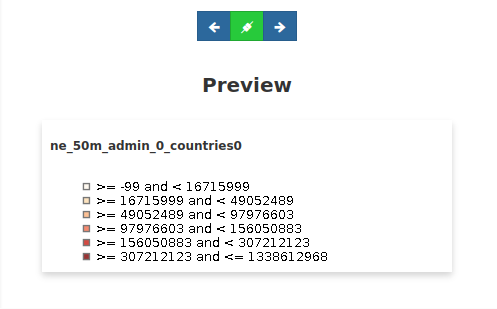
to add a new widget and from the list choose the Legendwidget type.You should see the legend for our world population map dataset (
ne_50m_admin_0_countries0) on the preview of the legend widget area.
Let’s move on by clicking the right arrow button
.Again, the final step is to provide a Title and a Description to our widget.
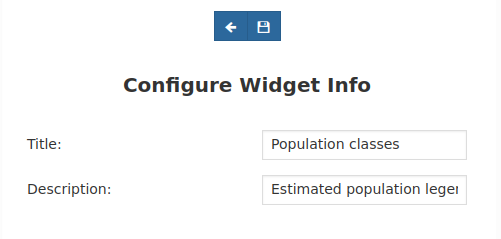
-Save it and add the widget to the map by clicking the floppy disk symbol save button .
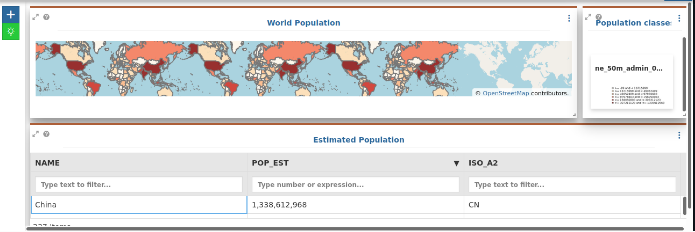
Move the widget and place it near the empty area to the right of our existing map. Adjust widgets’ sizes if needed to have a dashboard configuration similar to the next picture.
Add counter widget
As a final trial to our dashboard, we will include a
Counterwidget type to provide the total number of countries in the world.From the add more widget button
choose the widget type Counterfrom the list.Again, it will show a list of the available datasets to choose from. Choose the
ne_50m_admin_0_countries0dataset again.
Let’s move on by clicking the right arrow button
.Now we need to configure our widget and from the configuration page we can see:
Use- The property/column field to use for our calculationOperation- The available field level calculation available (COUNT,SUM,AVG, etc…)
Let’s use the field
fidand the operationcountfor this exercise.
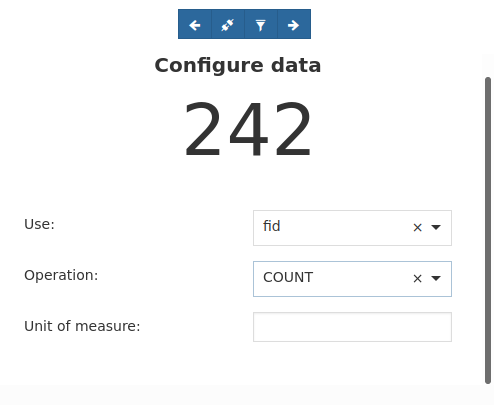
You should see already in the preview the total number of countries in the dataset (
242)Click the right arrow button
. Add a title and description to our configured widget.
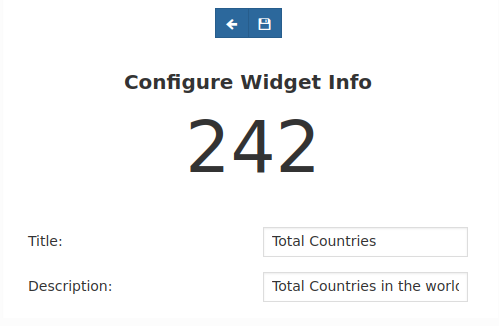
The final step is to save the widget and place the widget on our dashboard using the floppy disk button
. Feel free to place it somewhere as you will need to rearrange other existing widgets to allow our new Counterwidget to be clearly visible.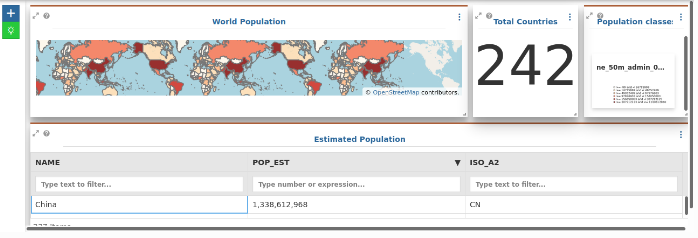
Congratulations!! You have built your first simple dashboard with GeoNode!