Styling with GeoNode (Basics)
This section introduces the concepts of the Styled Layer Descriptor (SLD) markup language.
SLD is the styling engine used by the GIS backend (i.e. GeoServer). It allows us to create beautiful and informative portrayals out of raw geospatial data.
In this section, you will also use the CSS extension module that allows you to build map styles using a compact, expressive styling language already well known to most web developers: Cascading Style Sheets.
The standard CSS language has been extended to allow for map filtering and managing all the details of producing a map.
The examples will have styles in SLD and CSS languages.
WARNING: CSS styling is only supported by GeoServer, which is the default GIS backend provided with GeoNode. In the official GeoServer Styling documentation, you can find useful references, such as the SLD Cookbook and the CSS Cookbook.
Uploading and Replacing the Dataset Default Style
This procedure allows us to quickly update and replace the current dataset default style with a new one from the hard disk.
WARNING: This procedure currently only works with SLD files
Before using the style, we will need to slightly modify it to match the correct field names of the
Mainrddataset.Go to the
Mainrddataset detail page;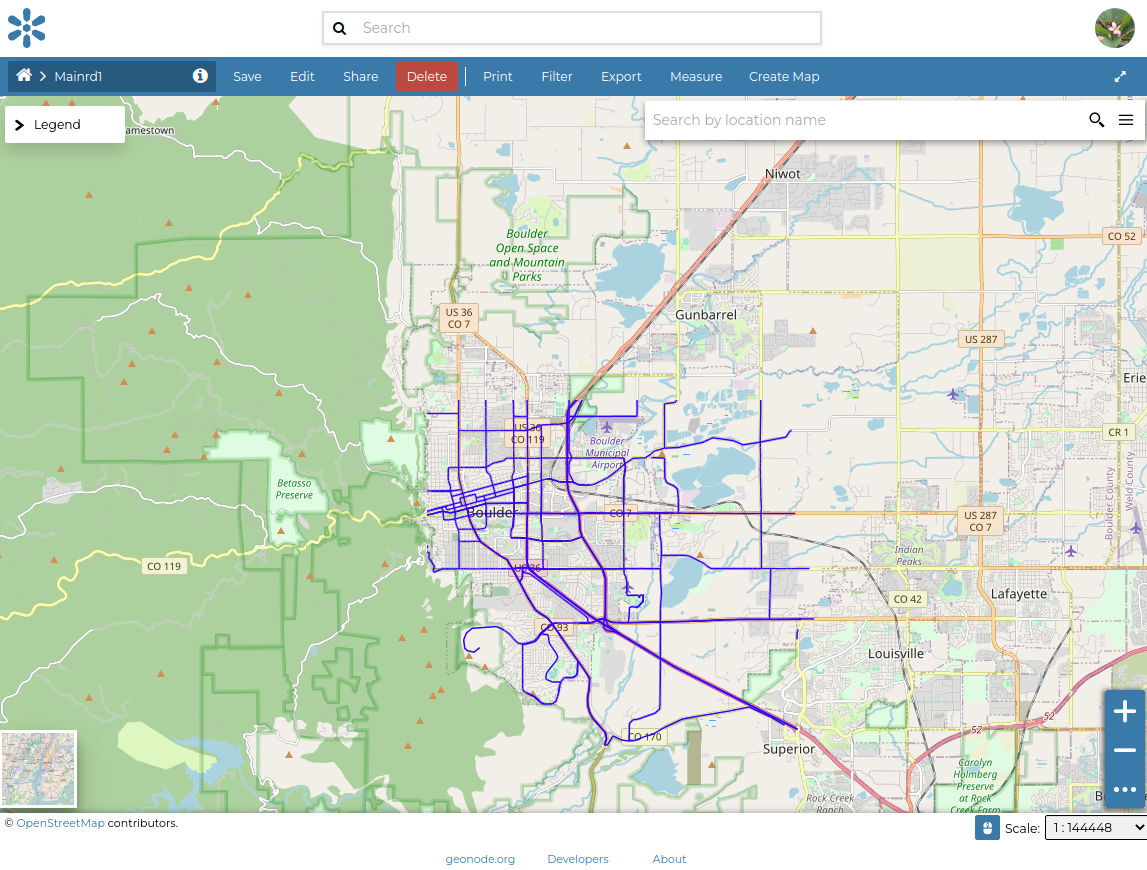
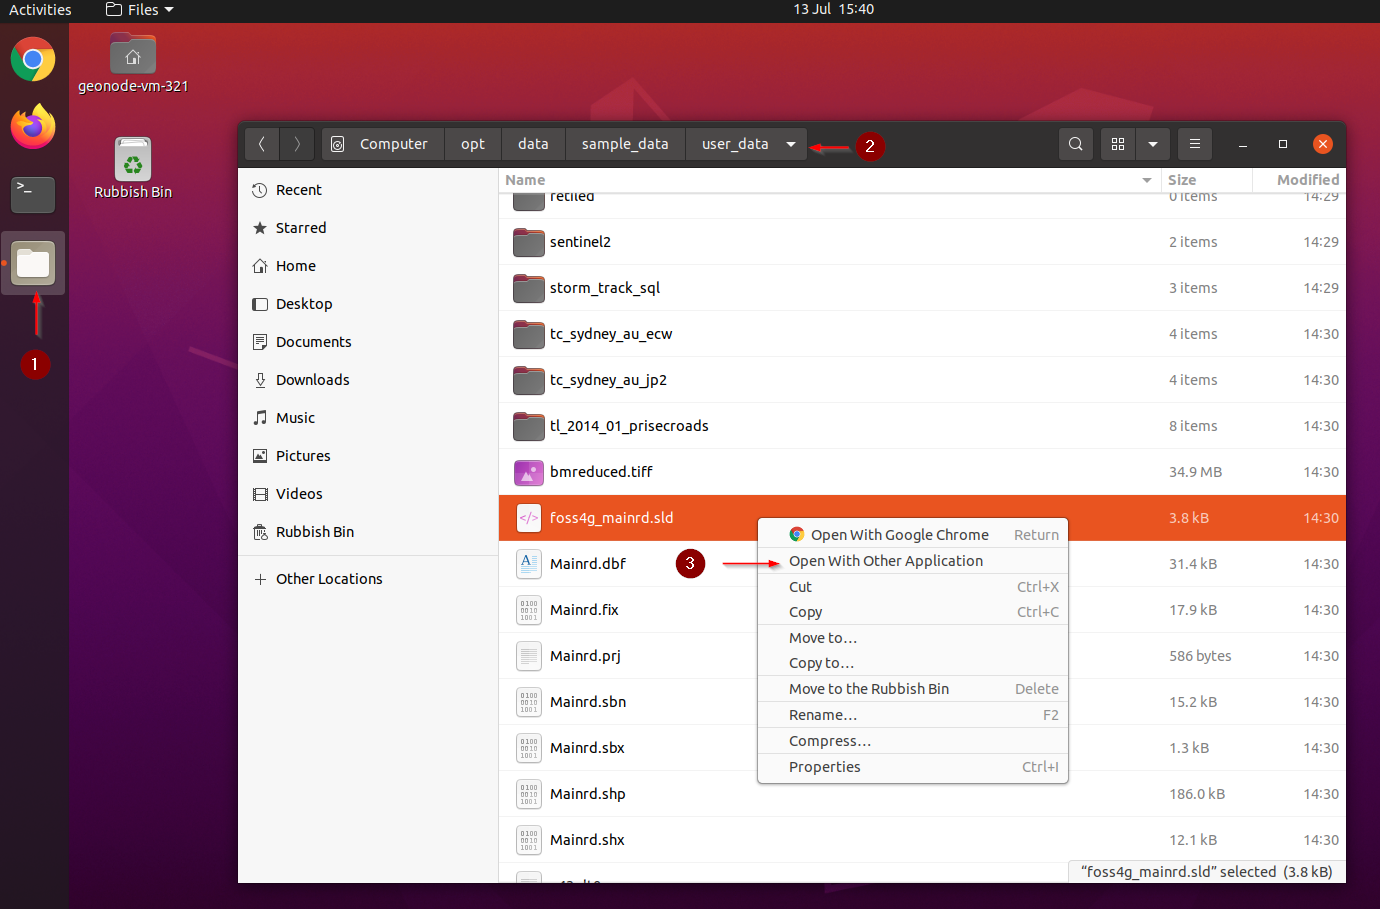
Click on 1.the system
File Browser, navigate to 2./opt/data/sample_data/user_dataRIGHT-CLICKwith the mouse on the file namedfoss4g_mainrd.sldSelect and click 3.
Open with Other Application
Click on the
View all applicationsbutton and then selectText Editorand change the 1.label_nameto uppercaseLABEL_NAME, click 2.Save, and 3.close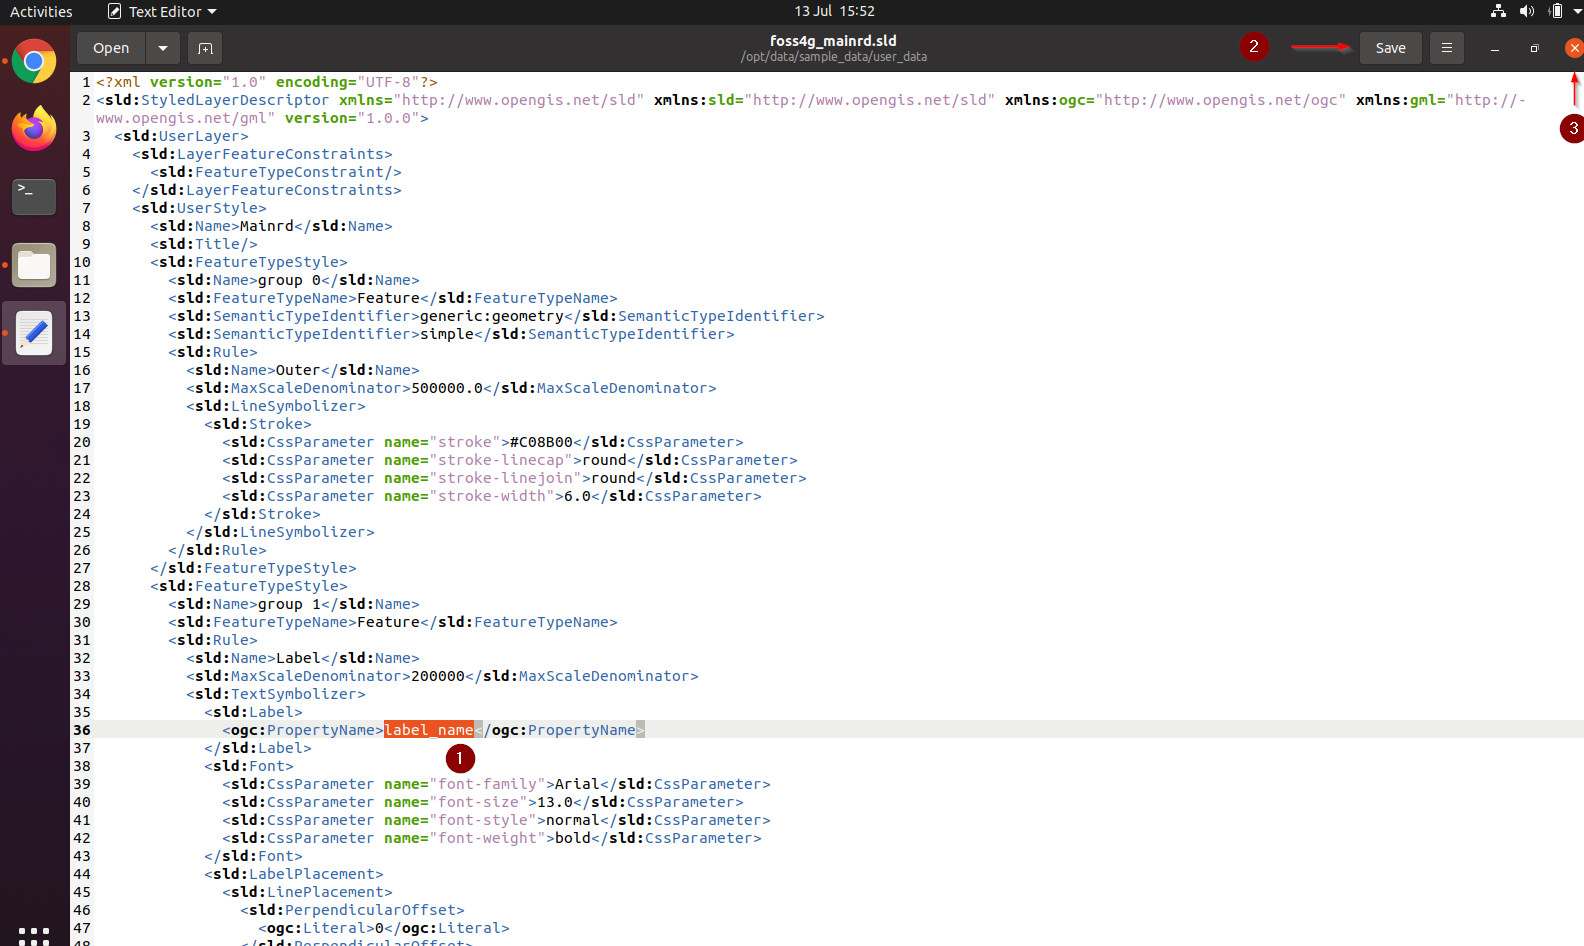
Go to the
Mainrddataset detail page; click on 1.Edit-> 2.Upload Style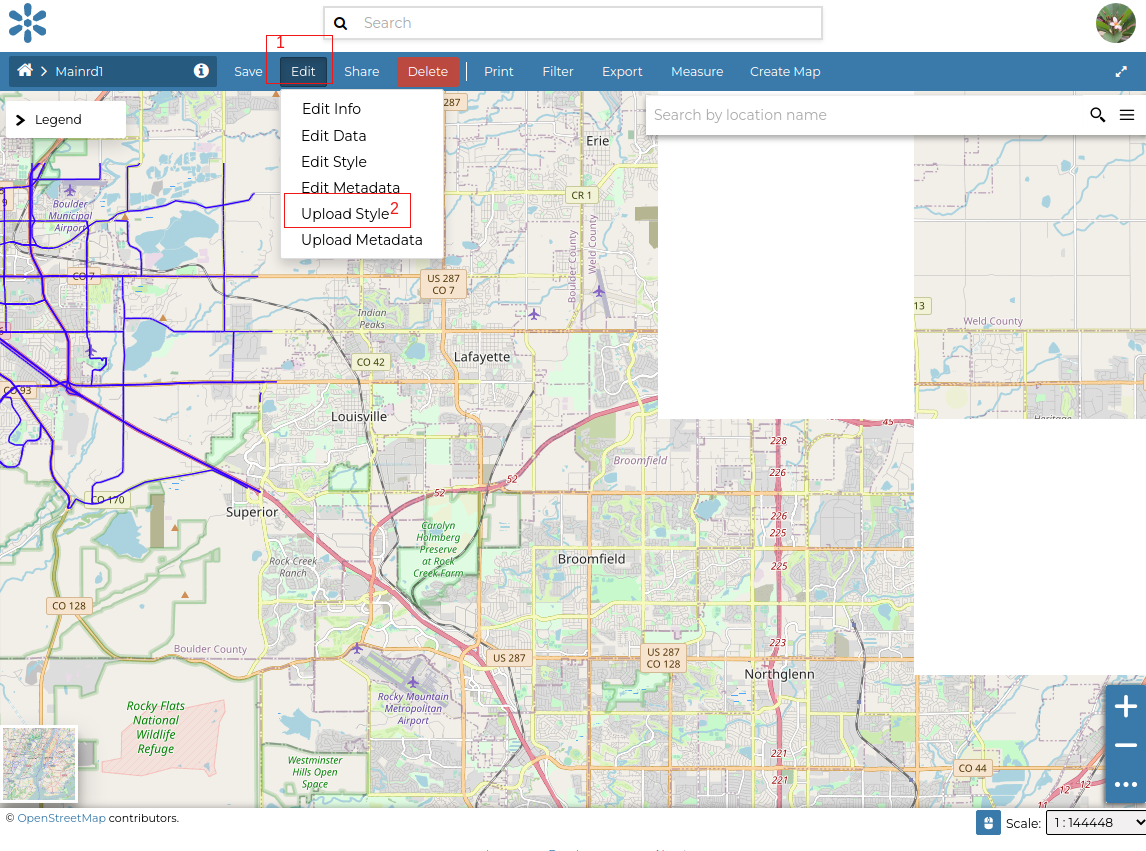
From the
Style Uploadpage, click on theChoose filesbutton and navigate to 1./opt/data/sample_data/user_data. Select the file 2.foss4g_mainrd.sldand then click on 3.Open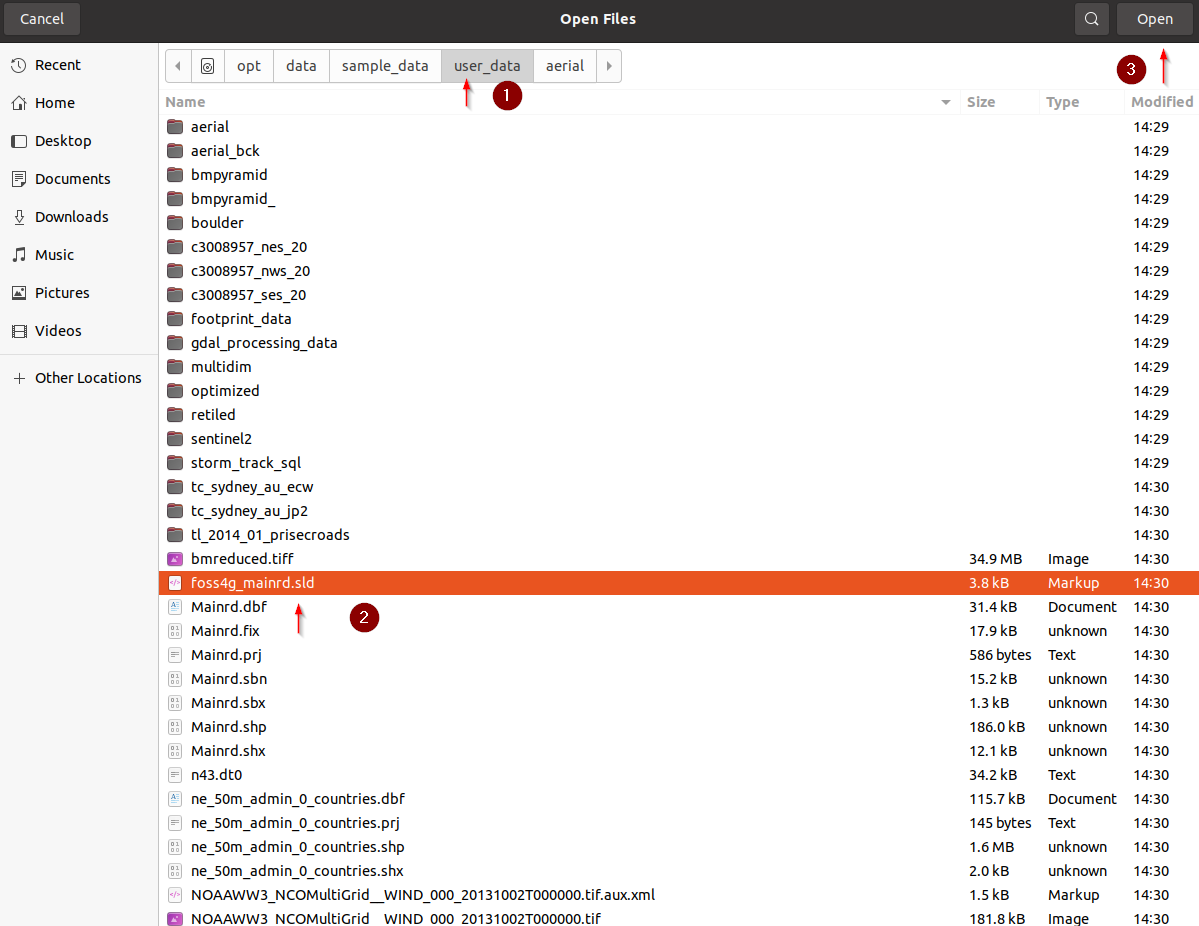
Click on
Upload fileand, once finished, onReturn to DatasetWARNING: If the page does not refresh correctly, click together
CTRL-SHIFT-CANCand clear the browser image cache from the last hour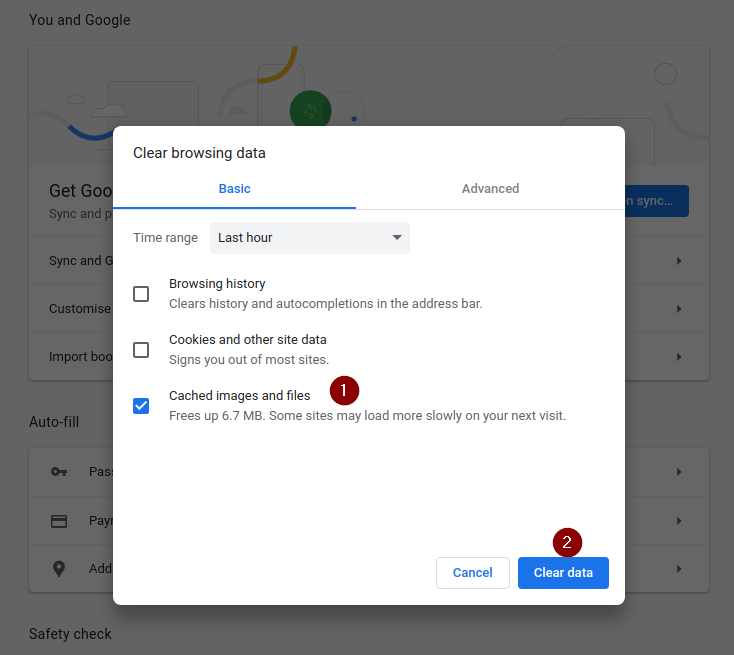
Go back to the dataset detail page and refresh the page. Notice how the
Legendhas changed, as has the styling of the dataset. Try zooming in, you will notice some labels appearing.Go ahead and update the
Thumbnailby clicking on theEdit->Edit Info. You can then update it in two ways: 1: click on the upload icon on the current thumbnail and upload an image from your device. 2: click on the map icon and adjust the map to the desired dimensions.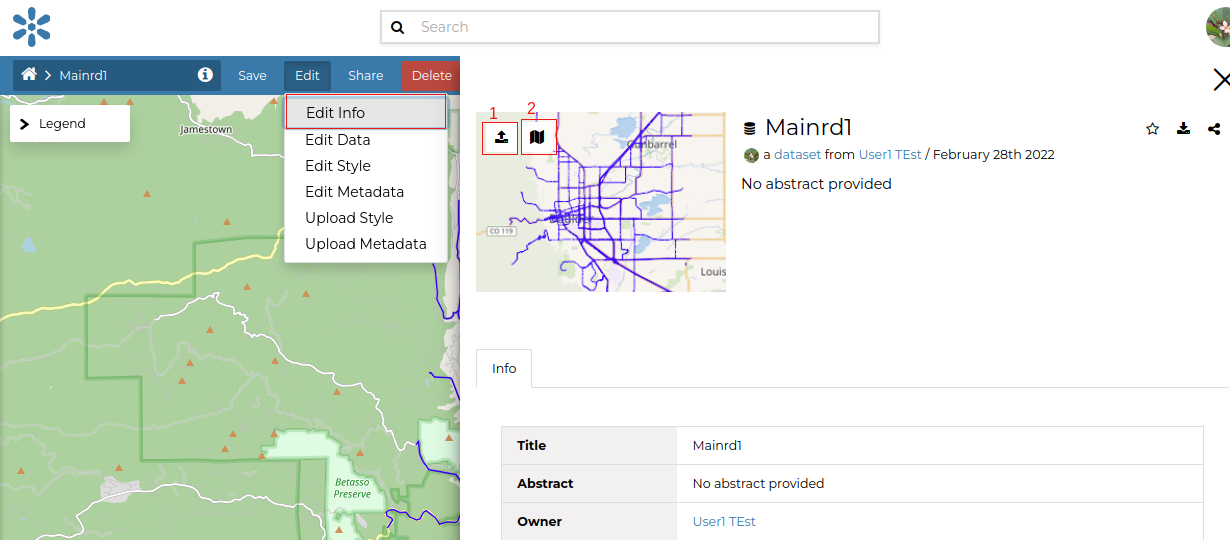
Once the thumbnail has been saved
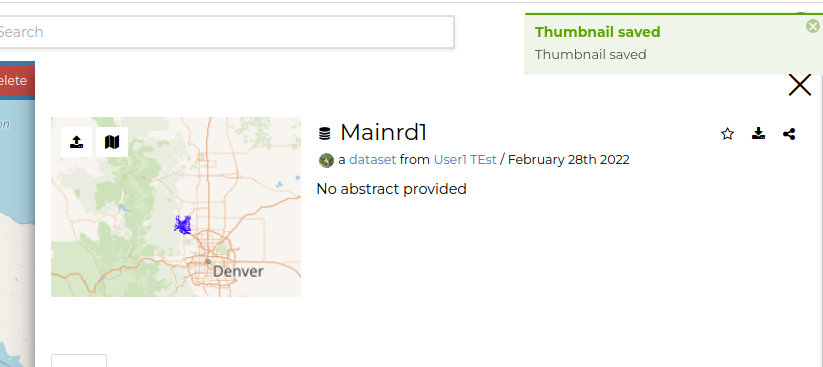
Go back to the datasets list and verify it has been updated
Adding more Base Datasets and Styles
Boulder City Limits
From the location
/opt/data/sample_data/pretty_maps/data/boulderupload the datasetBoulderCityLimits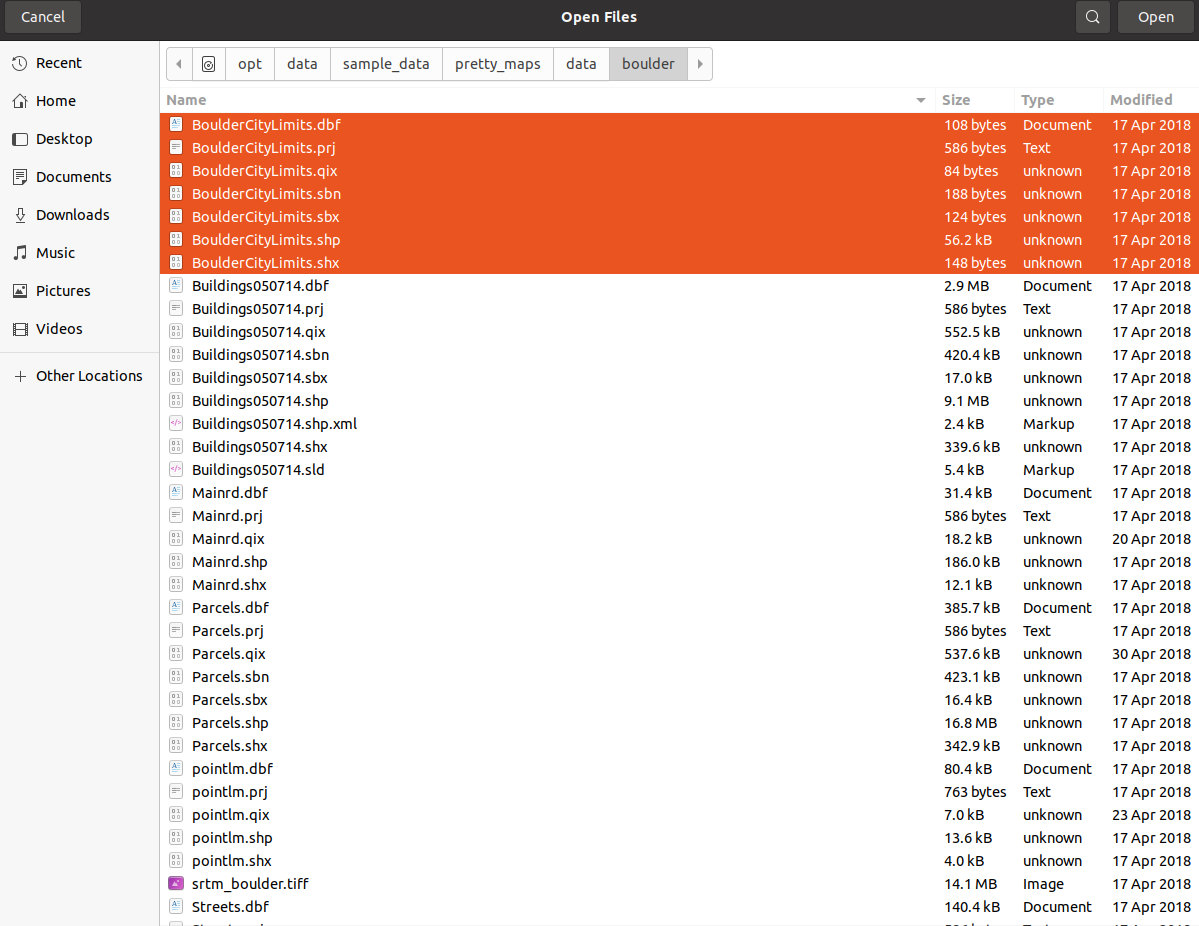
From the location
/opt/data/sample_data/pretty_maps/stylesupload the stylefoss4g_citylimits.sld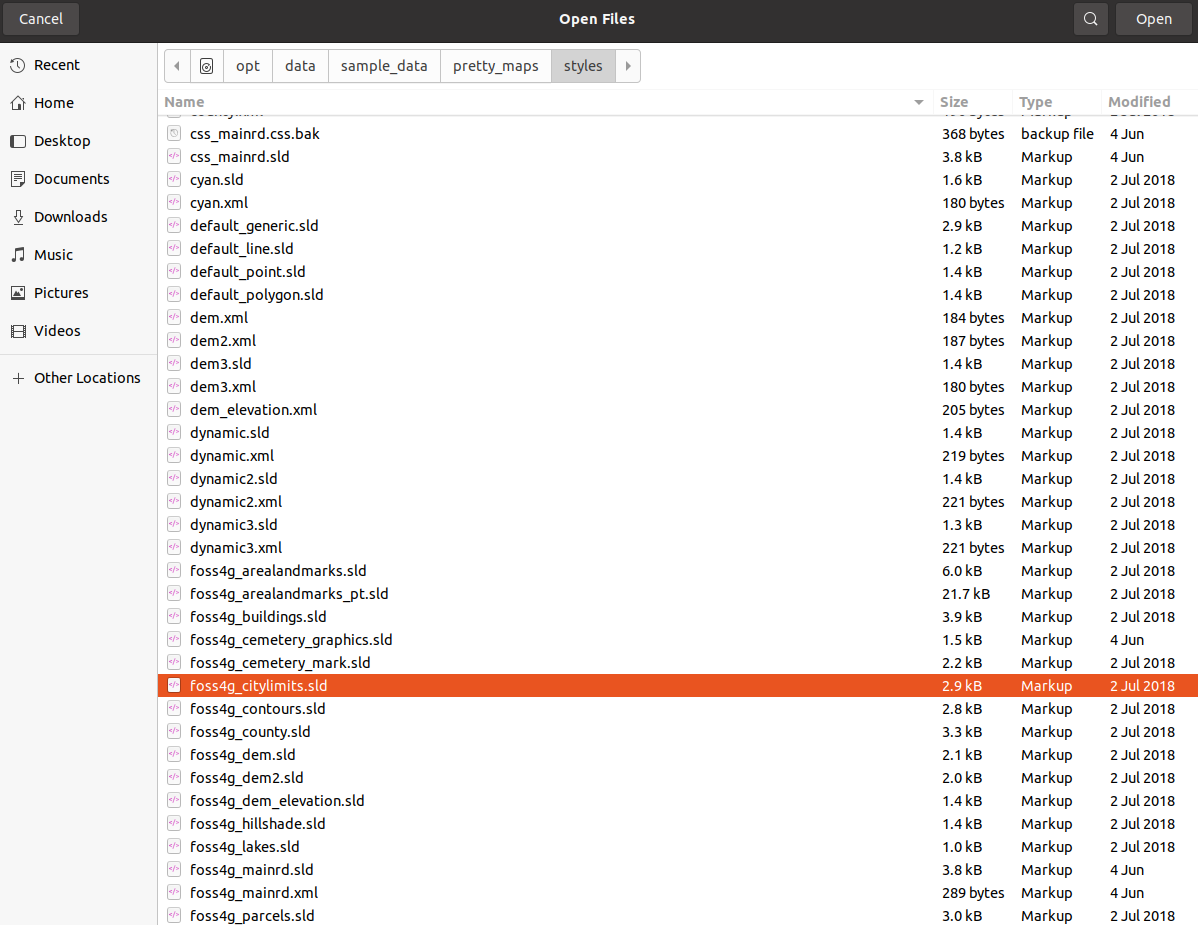
The dataset and legend should appear as shown here
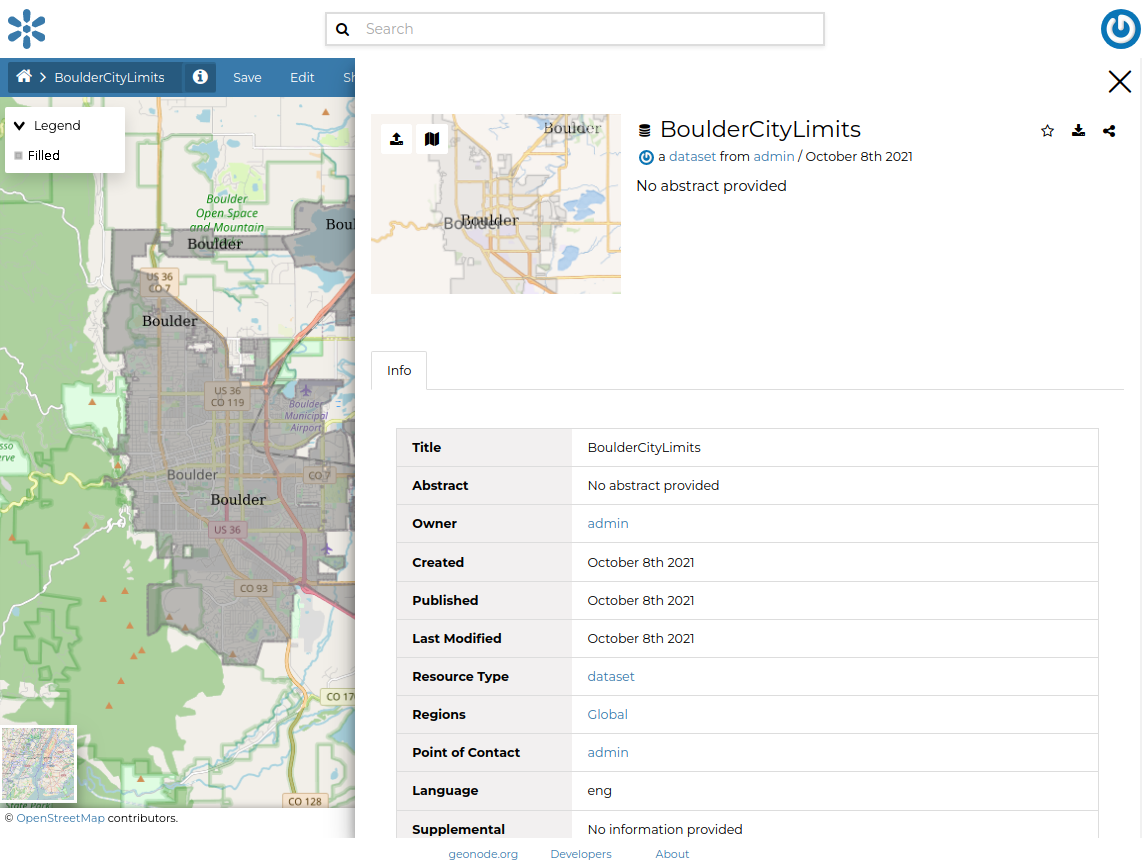
Set the thumbnail as we have done previously
Buildings
From the location
/opt/data/sample_data/pretty_maps/data/boulderupload the datasetBuildings050714WARNING: pay attention to only select the files shown in the figure below, do not include the
.sldand.xmlones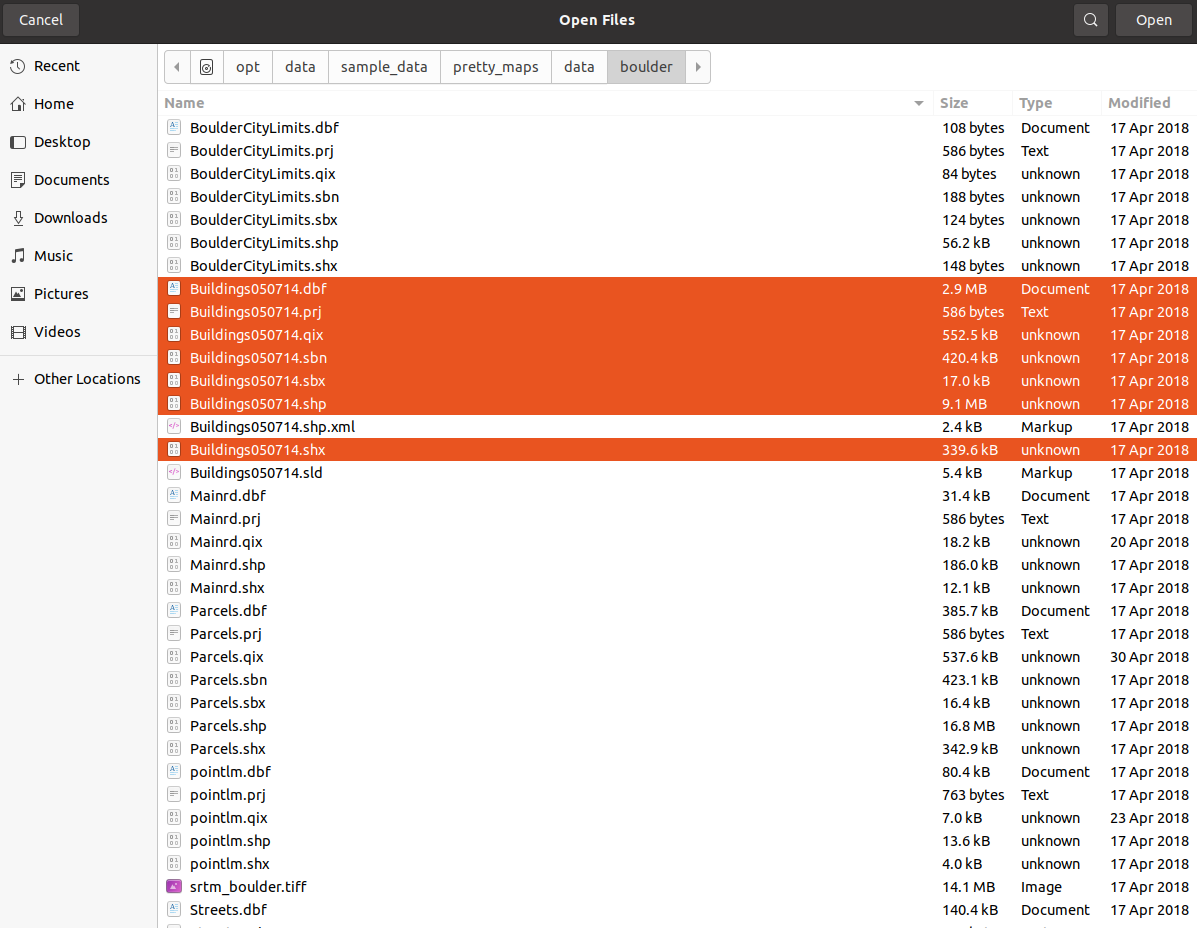
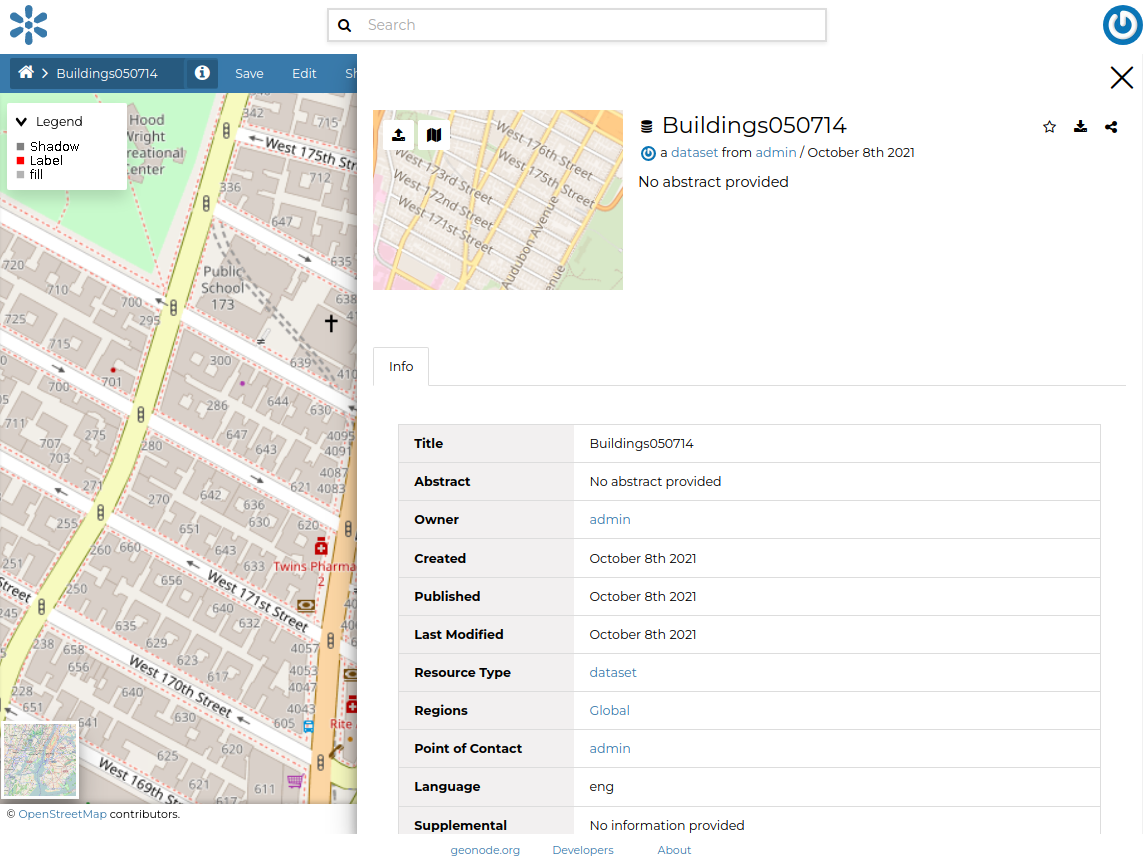
From the location
/opt/data/sample_data/pretty_maps/stylesupload the stylefoss4g_buildings.sldNotice that the Legend presents 3 different symbols, also notice that no feature will be visible unless you zoom very close to the buildings
By taking a closer look at the style source code, we can see that:
We have a set of
Ruleelements, each one constrained by someScaleDenominatorlimits.The
Shadowrule also defines aDisplacementmaking the polygons translate on theX-Ydataset
<?xml version="1.0" encoding="UTF-8"?>
  <sld:StyledLayerDescriptor xmlns="http://www.opengis.net/sld" xmlns:sld="http://www.opengis.net/sld" xmlns:ogc="http://www.opengis.net/ogc" xmlns:gml="http://www.opengis.net/gml" version="1.0.0">
    <sld:UserLayer>
      <sld:LayerFeatureConstraints>
        <sld:FeatureTypeConstraint/>
      </sld:LayerFeatureConstraints>
      <sld:UserStyle>
        <sld:Name>Buildings050714</sld:Name>
        <sld:Title/>
        <sld:IsDefault>1</sld:IsDefault>
        <sld:FeatureTypeStyle>
          <sld:Rule>
            <sld:Name>Shadow</sld:Name>
            <sld:MinScaleDenominator>5000.0</sld:MinScaleDenominator>
            <sld:MaxScaleDenominator>15000.0</sld:MaxScaleDenominator>
            <sld:PolygonSymbolizer>
              <sld:Geometry>
                <ogc:Function name="offset">
                  <ogc:PropertyName>the_geom</ogc:PropertyName>
                  <ogc:Literal>6.0</ogc:Literal>
                  <ogc:Literal>-6.0</ogc:Literal>
                </ogc:Function>
              </sld:Geometry>
              <sld:Fill/>
            </sld:PolygonSymbolizer>
          </sld:Rule>
        </sld:FeatureTypeStyle>
        <sld:FeatureTypeStyle>
          <sld:Rule>
            <sld:Name>Label</sld:Name>
            <sld:MaxScaleDenominator>10000.0</sld:MaxScaleDenominator>
            <sld:PolygonSymbolizer>
              <sld:Fill>
                <sld:CssParameter name="fill">#FF0000</sld:CssParameter>
              </sld:Fill>
            </sld:PolygonSymbolizer>
            <sld:TextSymbolizer>
              <sld:Label>
                <ogc:PropertyName>LABEL_NAME</ogc:PropertyName>
              </sld:Label>
              <sld:Font>
                <sld:CssParameter name="font-family">Arial</sld:CssParameter>
                <sld:CssParameter name="font-size">12.0</sld:CssParameter>
                <sld:CssParameter name="font-style">normal</sld:CssParameter>
                <sld:CssParameter name="font-weight">normal</sld:CssParameter>
              </sld:Font>
              <sld:LabelPlacement>
                <sld:PointPlacement>
                  <sld:AnchorPoint>
                    <sld:AnchorPointX>
                      <ogc:Literal>0.5</ogc:Literal>
                    </sld:AnchorPointX>
                    <sld:AnchorPointY>
                      <ogc:Literal>0.5</ogc:Literal>
                    </sld:AnchorPointY>
                  </sld:AnchorPoint>
                  <sld:Displacement>
                    <sld:DisplacementX>
                      <ogc:Literal>0.0</ogc:Literal>
                    </sld:DisplacementX>
                    <sld:DisplacementY>
                      <ogc:Literal>0.0</ogc:Literal>
                    </sld:DisplacementY>
                  </sld:Displacement>
                  <sld:Rotation>
                    <ogc:Literal>0.0</ogc:Literal>
                  </sld:Rotation>
                </sld:PointPlacement>
              </sld:LabelPlacement>
              <sld:Halo>
                <sld:Radius>
                  <ogc:Literal>2</ogc:Literal>
                </sld:Radius>
                <sld:Fill>
                  <sld:CssParameter name="fill">#FFFFFF</sld:CssParameter>
                </sld:Fill>
              </sld:Halo>
              <sld:Fill>
                <sld:CssParameter name="fill">#000000</sld:CssParameter>
              </sld:Fill>
              <sld:VendorOption name="autoWrap">100</sld:VendorOption>
              <sld:VendorOption name="maxDisplacement">50</sld:VendorOption>
            </sld:TextSymbolizer>
          </sld:Rule>
          <sld:Rule>
            <sld:Name>fill</sld:Name>
            <sld:MaxScaleDenominator>25000.0</sld:MaxScaleDenominator>
            <sld:PolygonSymbolizer>
              <sld:Fill>
                <sld:CssParameter name="fill">#B3B3B3</sld:CssParameter>
              </sld:Fill>
            </sld:PolygonSymbolizer>
          </sld:Rule>
        </sld:FeatureTypeStyle>
      </sld:UserStyle>
    </sld:UserLayer>
  </sld:StyledLayerDescriptor>
Set the thumbnail as we have done previously
Parcels
From the location
/opt/data/sample_data/pretty_maps/data/boulderupload the datasetParcels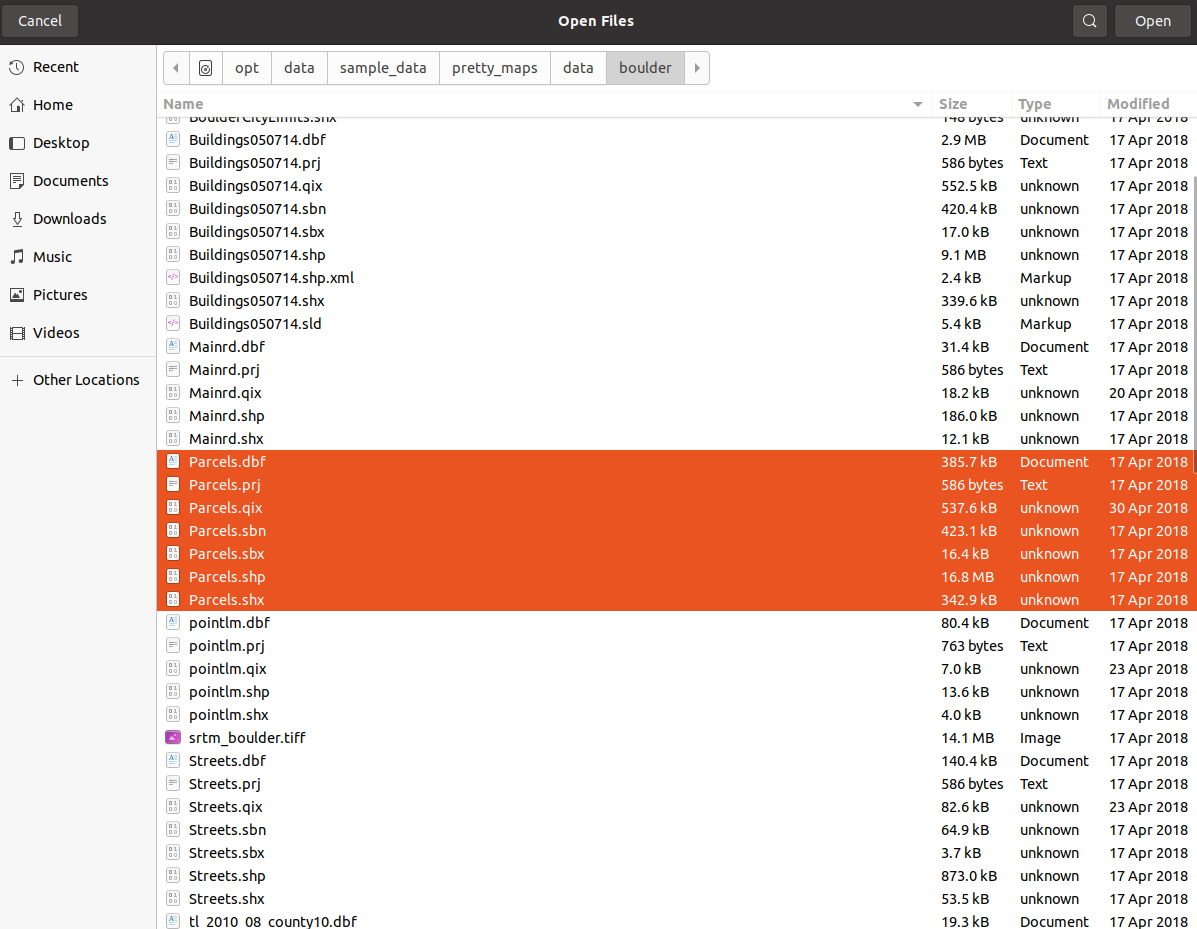
From the location
/opt/data/sample_data/pretty_maps/stylesupload the stylefoss4g_parcels.sld. The dataset only appears at very high levels of zoom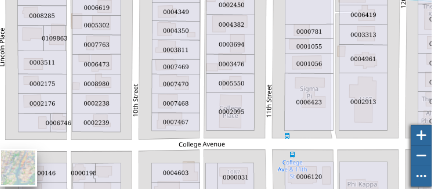
Set the thumbnail as we have done previously
Pointlm
From the location
/opt/data/sample_data/pretty_maps/data/boulderupload the datasetpointlmFrom the location
/opt/data/sample_data/pretty_maps/stylesupload the stylefoss4g_point_landmark_ds_ns.sldAt a first glance, the dataset will appear as a set of grey square points. Let’s take a closer look at the
SLDdefinition<?xml version="1.0" encoding="UTF-8"?> <sld:StyledLayerDescriptor xmlns="http://www.opengis.net/sld" xmlns:sld="http://www.opengis.net/sld" xmlns:ogc="http://www.opengis.net/ogc" xmlns:gml="http://www.opengis.net/gml" xmlns:xlink="http://www.w3.org/1999/xlink" version="1.0.0"> <sld:UserLayer> <sld:LayerFeatureConstraints> <sld:FeatureTypeConstraint/> </sld:LayerFeatureConstraints> <sld:UserStyle> <sld:Name>tl 2010 08013 pointlm</sld:Name> <sld:Title/> <sld:FeatureTypeStyle> <sld:Rule> <sld:Name>landmarks</sld:Name> <ogc:Filter> <ogc:PropertyIsGreaterThan> <ogc:Function name="strLength"> <ogc:PropertyName>IMAGE</ogc:PropertyName> </ogc:Function> <ogc:Literal>0</ogc:Literal> </ogc:PropertyIsGreaterThan> </ogc:Filter> <sld:PointSymbolizer> <sld:Graphic> <sld:ExternalGraphic> <sld:OnlineResource xlink:type="simple" xlink:href="./img/landmarks/${IMAGE}" /> <sld:Format>image/png</sld:Format> </sld:ExternalGraphic> </sld:Graphic> <VendorOption name="labelObstacle">true</VendorOption> </sld:PointSymbolizer> <sld:TextSymbolizer> <sld:Label> <ogc:PropertyName>FULLNAME</ogc:PropertyName> </sld:Label> <sld:Font> <sld:CssParameter name="font-family">Arial</sld:CssParameter> <sld:CssParameter name="font-size">12.0</sld:CssParameter> <sld:CssParameter name="font-style">normal</sld:CssParameter> <sld:CssParameter name="font-weight">normal</sld:CssParameter> </sld:Font> <sld:LabelPlacement> <sld:PointPlacement> <sld:AnchorPoint> <sld:AnchorPointX> <ogc:Literal>0.5</ogc:Literal> </sld:AnchorPointX> <sld:AnchorPointY> <ogc:Literal>1.0</ogc:Literal> </sld:AnchorPointY> </sld:AnchorPoint> <sld:Displacement> <sld:DisplacementX> <ogc:Literal>0.0</ogc:Literal> </sld:DisplacementX> <sld:DisplacementY> <ogc:Literal>-14.0</ogc:Literal> </sld:DisplacementY> </sld:Displacement> <sld:Rotation> <ogc:Literal>0.0</ogc:Literal> </sld:Rotation> </sld:PointPlacement> </sld:LabelPlacement> <sld:Halo> <sld:Radius> <ogc:Literal>1.5</ogc:Literal> </sld:Radius> <sld:Fill> <sld:CssParameter name="fill">#FFFFFF</sld:CssParameter> </sld:Fill> </sld:Halo> <sld:Fill> <sld:CssParameter name="fill">#000033</sld:CssParameter> </sld:Fill> <sld:Priority>200000</sld:Priority> <sld:VendorOption name="autoWrap">100</sld:VendorOption> </sld:TextSymbolizer> </sld:Rule> </sld:FeatureTypeStyle> </sld:UserStyle> </sld:UserLayer> </sld:StyledLayerDescriptor>
We can see the notation
xlink:href="./img/landmarks/${IMAGE}", this is a GeoServer extension allowing us to read some values from the source dataset attributes and then use them to dynamically render theSLD.In that specific case, GeoServer looks for some filenames according to the
${IMAGE}attribute value in a relative folder named./img/landmarks/.To correctly render this style, we will need to copy this folder, containing the correctly named images, into the GeoServer
stylesfolder.We will also have to give that folder the correct permissions to allow GeoServer to access it.
The first step is to copy the
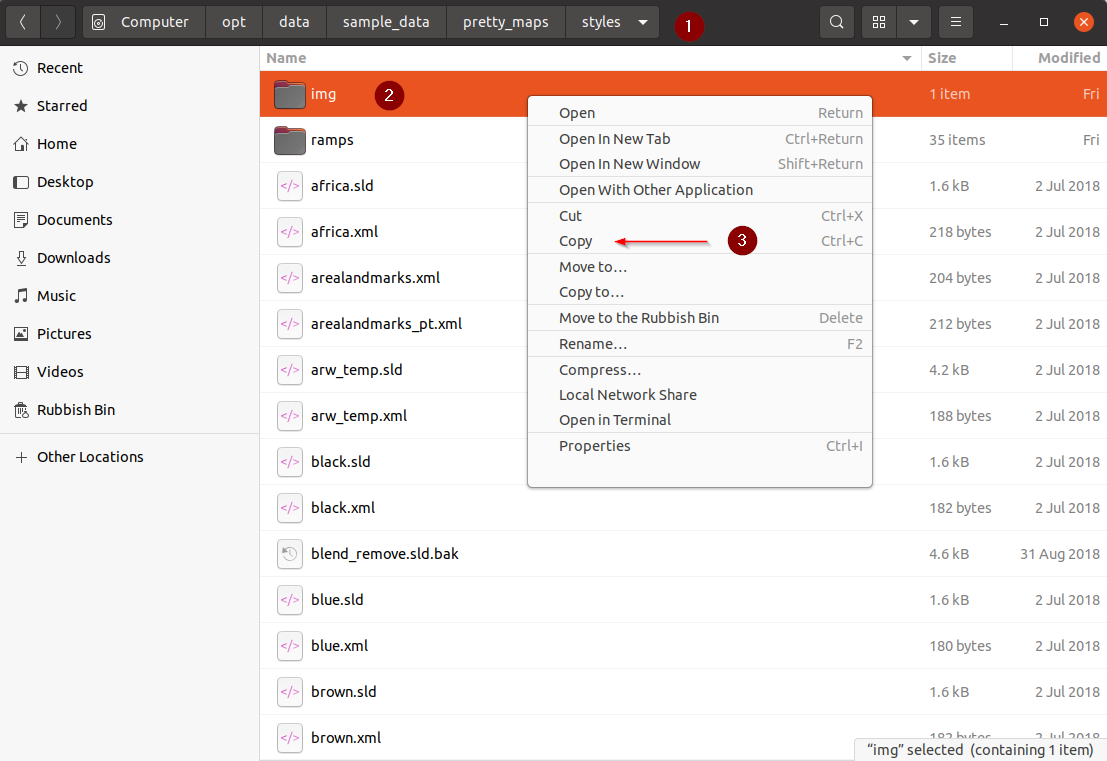
imgfolder into the correct GeoServerstylesoneOpen a
system file browserwindow and go to 1./opt/data/sample_data/pretty_maps/stylesRIGHT-CLICKon the 2.imgfolderSelect 3.
Copyfrom the side menu
From the
system file browserwindow go to/opt/data/geoserver_data/workspaces/geonode/, it will probably ask forROOTpermissions. Just insert the passwordgeonodeevery time it asks for one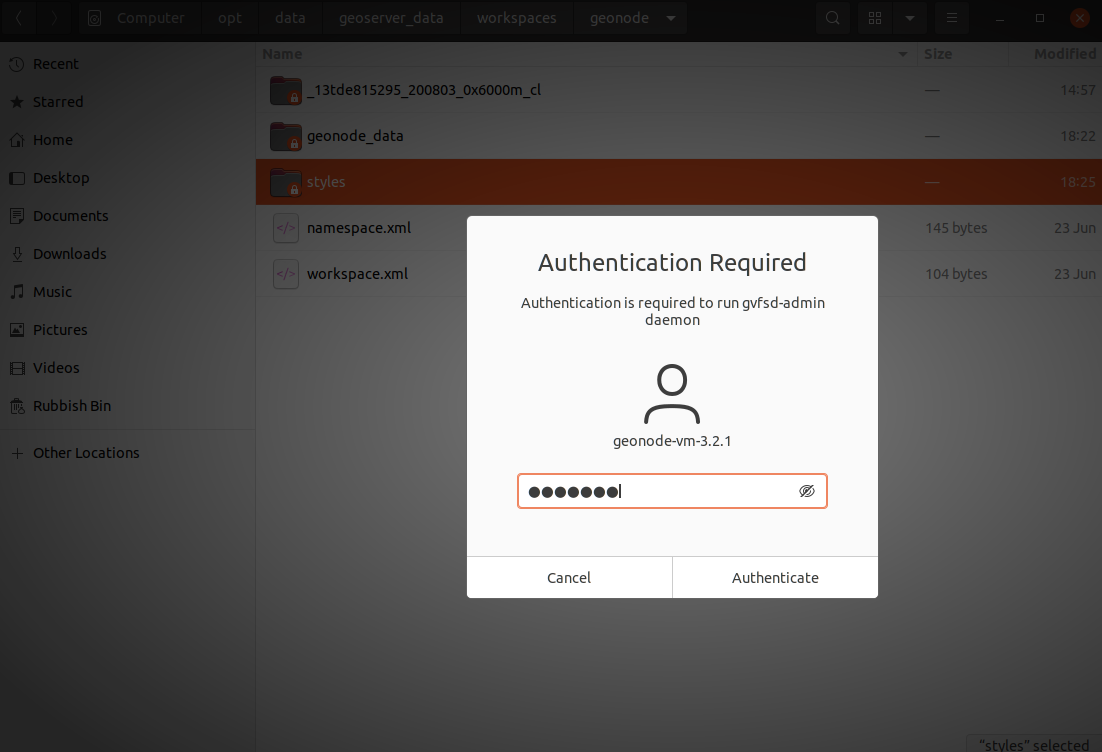
Go to the styles folder inside the GeoNode workspace and hit
CTRL+V, this will copy theimgfolder into the new location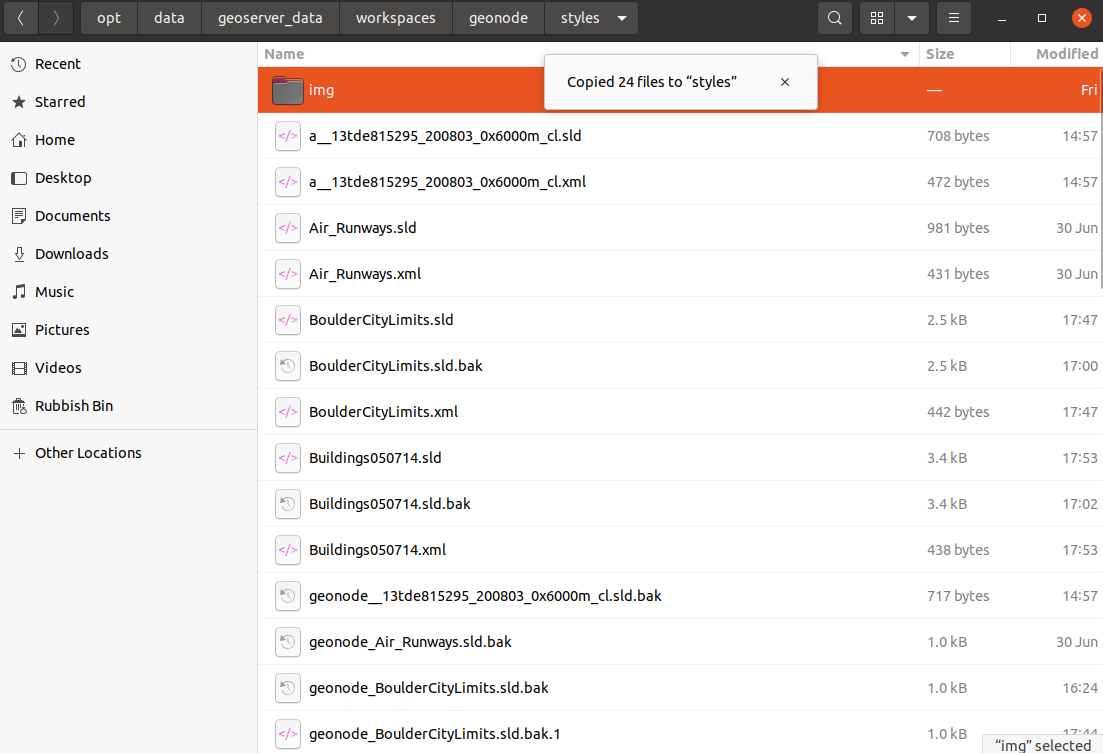
RIGHT-CLICKon the newly created 2.imgfolder and click on the 3.Propertieslink of the context menu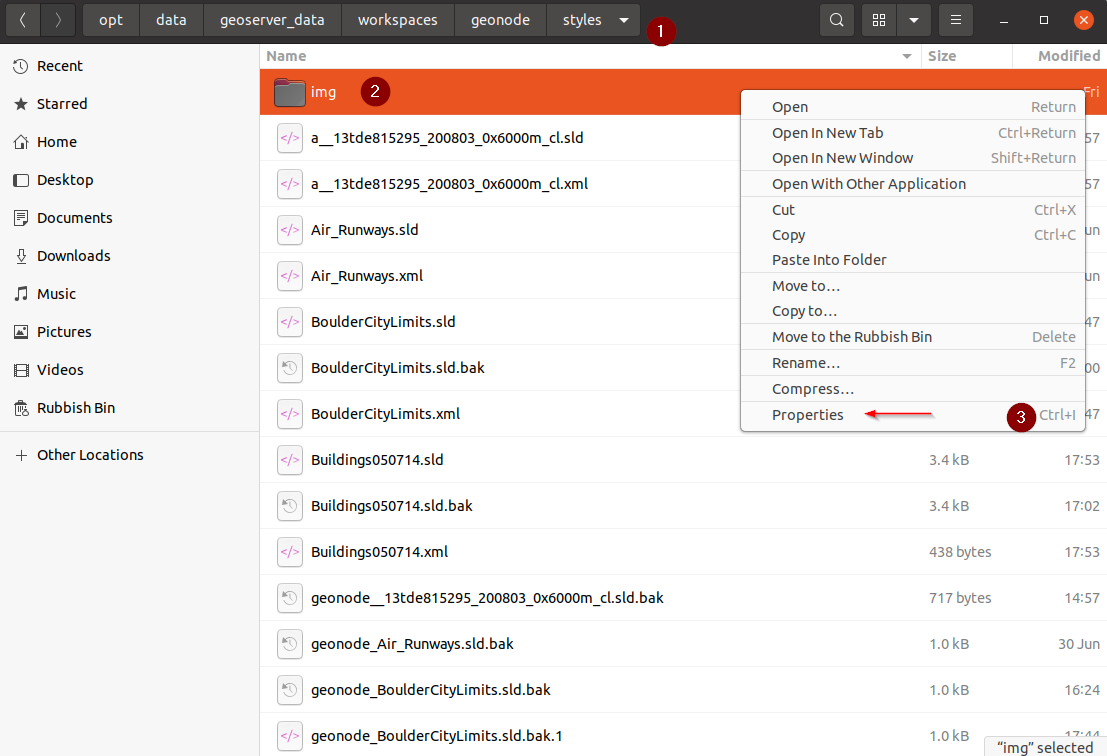
Assign the permissions to the
others groupas shown in the figure below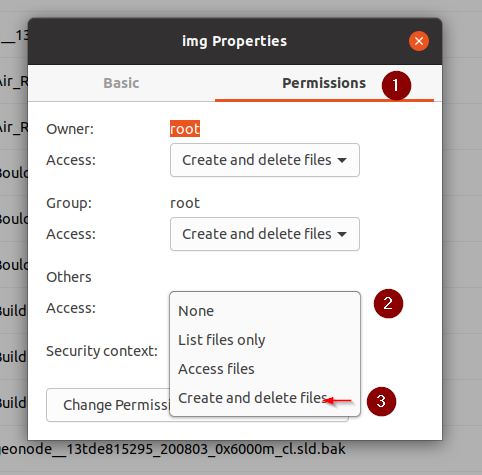
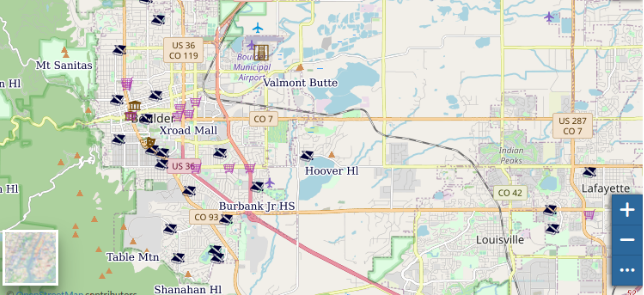
Refresh the dataset page, you should be able to see the icons appearing on the map preview
Set the thumbnail as we have done previously
Remaining Boulders datasets
From the location
/opt/data/sample_data/pretty_maps/data/boulderupload the datasets:srtm_boulderStreetsTrailsWetlands_regulatory_area
From the location
/opt/data/sample_data/pretty_maps/stylesupload the styles:foss4g_dem2.sldtosrtm_boulderfoss4g_streets.sldtoStreetsfoss4g_trails.sldtoTrailsfoss4g_wetlands.sldtoWetlands_regulatory_area