Pretty Maps with GeoNode
Introduction to Web Map Service
A Web Map Service provides:
A set of datasets (each in its own map projection)
One or more named styles per dataset (at least one)
The ability to request any list of datasets with their styles to build a map
A set of target projections in which the map can be composed
Ability to ask “any” map size and scale denominator
Optional ability to query the map (info tool, “what’s here?”)
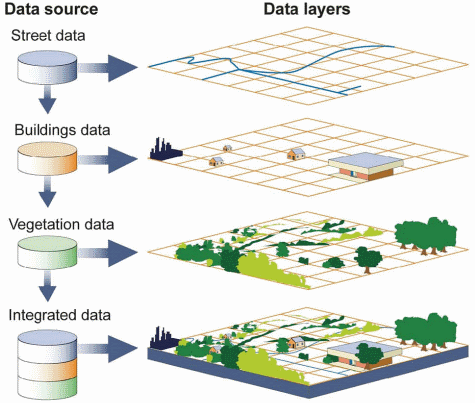
The flexibility of this model allows clients to build their own maps by selecting only the datasets of interest, integrating map layers from different servers (assuming there is at least one common target projection among the servers), and using local data too if needed.
This introduction showcases the WMS 1.1 protocol version, as it is easier to explain compared to the newer 1.3 version, in which a different axis order must be used depending on the requested coordinate reference system. The main concepts are very similar, and so are the requests.
GetCapabilities
Like most OGC protocols, WMS exposes a GetCapabilities request. To see the full contents of the local GeoServer WMS 1.3 capabilities document follow this link:
http://localhost/geoserver/ows?service=wms&version=1.3.0&request=GetCapabilities
The result is a very large XML document, meant to be parsed by a computer, we’ll look only at some highlights here.
The service section
This section provides a way to describe the service contents (title, abstract) and points of contact that can be used to inquire about report issues, the service, and the link.
The contact information comes from the homonymous configuration page in the Contact information menu of the GeoServer administration interface.
<Service>
  <Name>WMS</Name>
  <Title>GeoNode Local GeoServer</Title>
  <Abstract>This is a description of your Web Map Server.</Abstract>
  <KeywordList>
    <Keyword>WFS</Keyword>
    <Keyword>WMS</Keyword>
    <Keyword>GEOSERVER</Keyword>
  </KeywordList>
  <OnlineResource xlink:type="simple" xlink:href="http://geoserver.sourceforge.net/html/index.php"/>
  <ContactInformation>
    <ContactPersonPrimary>
      <ContactPerson/>
      <ContactOrganization/>
    </ContactPersonPrimary>
    <ContactPosition/>
    <ContactAddress>
      <AddressType/>
      <Address/>
      <City/>
      <StateOrProvince/>
      <PostCode/>
      <Country/>
    </ContactAddress>
    <ContactVoiceTelephone/>
    <ContactFacsimileTelephone/>
    <ContactElectronicMailAddress/>
  </ContactInformation>
  <Fees>NONE</Fees>
  <AccessConstraints>NONE</AccessConstraints>
</Service>
The capability section
This section reports which requests the server can handle and some information about the requests, such as the output formats.
Did you know that:
Not all requests are mandatory, only
GetCapabilityandGetMapare,GetFeatureInfois notOnly one among
PNG,JPEGandGIFGetMapoutput format is required, but look at how many GeoServer supports
<Capability>
<Request>
<GetCapabilities>
<Format>text/xml</Format>
<DCPType>
<HTTP>
<Get>
<OnlineResource xlink:type="simple" xlink:href="http://localhost/geoserver/ows?SERVICE=WMS&"/>
</Get>
<Post>
<OnlineResource xlink:type="simple" xlink:href="http://localhost/geoserver/ows?SERVICE=WMS&"/>
</Post>
</HTTP>
</DCPType>
</GetCapabilities>
<GetMap>
<Format>image/png</Format>
<Format>application/atom+xml</Format>
<Format>application/json;type=utfgrid</Format>
<Format>application/pdf</Format>
<Format>application/rss+xml</Format>
<Format>application/vnd.google-earth.kml+xml</Format>
<Format>application/vnd.google-earth.kml+xml;mode=networklink</Format>
<Format>application/vnd.google-earth.kmz</Format>
<Format>image/geotiff</Format>
<Format>image/geotiff8</Format>
<Format>image/gif</Format>
<Format>image/jpeg</Format>
<Format>image/png; mode=8bit</Format>
<Format>image/svg+xml</Format>
<Format>image/tiff</Format>
<Format>image/tiff8</Format>
<Format>image/vnd.jpeg-png</Format>
<Format>image/vnd.jpeg-png8</Format>
<Format>text/html; subtype=openlayers</Format>
<Format>text/html; subtype=openlayers2</Format>
<Format>text/html; subtype=openlayers3</Format>
<DCPType>
<HTTP>
<Get>
<OnlineResource xlink:type="simple" xlink:href="http://localhost/geoserver/ows?SERVICE=WMS&"/>
</Get>
</HTTP>
</DCPType>
</GetMap>
<GetFeatureInfo>
<Format>text/plain</Format>
<Format>application/vnd.ogc.gml</Format>
<Format>text/xml</Format>
<Format>application/vnd.ogc.gml/3.1.1</Format>
<Format>text/xml; subtype=gml/3.1.1</Format>
<Format>text/html</Format>
<Format>application/json</Format>
<DCPType>
<HTTP>
<Get>
<OnlineResource xlink:type="simple" xlink:href="http://localhost/geoserver/ows?SERVICE=WMS&"/>
</Get>
</HTTP>
</DCPType>
</GetFeatureInfo>
</Request>
...
The Contents section
This section in WMS contains a tree of datasets.
The tree has several consequences:
It is a way to organize data by themes
It is a way to group datasets. Asking for one dataset makes the server return all its child datasets in the order that they are defined
It allows inheritance. The properties of the parent dataset are inherited by all child datasets
The contents section starts with a root dataset that can be used to get all datasets in a single shot and that lists all the target projections that a map can be reprojected into.
By default GeoServer lists all those found in the EPSG database, and it can be configured by setting the Limited SRS list in the GeoServer WMS admin page:
<Layer>
  <Title>GeoNode Local GeoServer</Title>
  <Abstract>This is a description of your Web Map Server.</Abstract>
  <!--Limited list of EPSG projections:-->
  <CRS>EPSG:4326</CRS>
  <CRS>EPSG:3785</CRS>
  <CRS>EPSG:3857</CRS>
  <CRS>EPSG:900913</CRS>
  <CRS>EPSG:32647</CRS>
  <CRS>EPSG:32736</CRS>
  <CRS>CRS:84</CRS>
  <EX_GeographicBoundingBox>
    <westBoundLongitude>-117.36526677636073</westBoundLongitude>
    <eastBoundLongitude>-105.00013888888888</eastBoundLongitude>
    <southBoundLatitude>32.534227762958466</southBoundLatitude>
    <northBoundLatitude>40.30013888888889</northBoundLatitude>
  </EX_GeographicBoundingBox>
  <BoundingBox CRS="CRS:84" minx="-117.36526677636073" miny="32.534227762958466" maxx="-105.00013888888888" maxy="40.30013888888889"/>
  <BoundingBox CRS="EPSG:4326" minx="32.534227762958466" miny="-117.36526677636073" maxx="40.30013888888889" maxy="-105.00013888888888"/>
  <BoundingBox CRS="EPSG:3785" minx="-1.3065041734361183E7" miny="3810657.25465308" maxx="-1.1688561994334111E7" maxy="4881998.79461361"/>
  <BoundingBox CRS="EPSG:3857" minx="-1.3065041734361183E7" miny="3833642.429924806" maxx="-1.1688561994334111E7" maxy="4909653.984025123"/>
  <BoundingBox CRS="EPSG:900913" minx="-1.3065041734361183E7" miny="3833642.429924806" maxx="-1.1688561994334111E7" maxy="4909653.984025123"/>
  <BoundingBox CRS="EPSG:32647" minx="-3.951956507952588E7" miny="1.9702860254844192E7" maxx="-9842223.141078195" maxy="8.402118175739984E7"/>
  <BoundingBox CRS="EPSG:32736" minx="5073132.765295756" miny="3.0483944181415446E7" maxx="2.9354901643614803E7" maxy="7.986815078653288E7"/>
  ...
After the list of coordinate reference systems, the actual datasets show up with their own bounding box, styles, and legend reference:
<Layer queryable="1" opaque="0">
  <Name>geonode:Air_Runways</Name>
  <Title>Air_Runways</Title>
  <Abstract>Airport Runways</Abstract>
  <KeywordList>
    <Keyword>features</Keyword>
    <Keyword>Air_Runways</Keyword>
    <Keyword>Runway</Keyword>
    <Keyword>Airport</Keyword>
    <Keyword>Airports</Keyword>
    <Keyword>Runways</Keyword>
    <Keyword>Landing Strips</Keyword>
  </KeywordList>
  <CRS>EPSG:2230</CRS>
  <CRS>CRS:84</CRS>
  <EX_GeographicBoundingBox>
    <westBoundLongitude>-117.36526677636073</westBoundLongitude>
    <eastBoundLongitude>-116.12621141861304</eastBoundLongitude>
    <southBoundLatitude>32.534227762958466</southBoundLatitude>
    <northBoundLatitude>33.36158563104289</northBoundLatitude>
  </EX_GeographicBoundingBox>
  ...
This section allows the client to figure out which datasets are available, where they are located, and what coordinate reference systems can be used in requests, thus building the GetMap request.
GetMap
The GetMap request allows a client to ask the server to generate a portrayal of a dataset given a specific style (it will use the default one if none has been provided).
A GetMap request is an HTTP GET URI with a well-defined query-string. As an example, the following is a typical GetMap request:
Element |
Description |
|---|---|
http://localhost/geoserver/geonode/wms? |
The base URL |
service=WMS |
The service |
version=1.1.0 |
The service version |
request=GetMap |
The request |
layers=geonode:states |
The list of datasets (comma separated, can be one) |
styles= |
The list of style names (comma separated, can be empty to use the default) |
bbox=-124.73142200000001, 24.955967,-66.969849, 49.371735 |
The area that should be depicted |
width=768 |
Width of the output in pixels |
height=330 |
Height of the output in pixels |
srs=EPSG:4326 |
The output coordinate reference system (the BBOX is expressed in this SRS) |
format=image/png |
The requested format (could have been image/png, image/jpeg, or any other listed in the capabilities document) |
GetFeatureInfo
The GetFeatureInfo request allows clients to issue a “what’s here” request for one or more of the requested datasets.
The “here” is specified by giving the coordinates of the pixel that the user clicked inside the GetMap output the user is looking at.
As an example, go to any of the dataset’s details page and click on a point on the map corresponding to some data. You’ll get information about the data on that specific position.
Creating a Base Map
From the
Add Resourcedropdown menu on the resources list page, click on theCreate Maplink
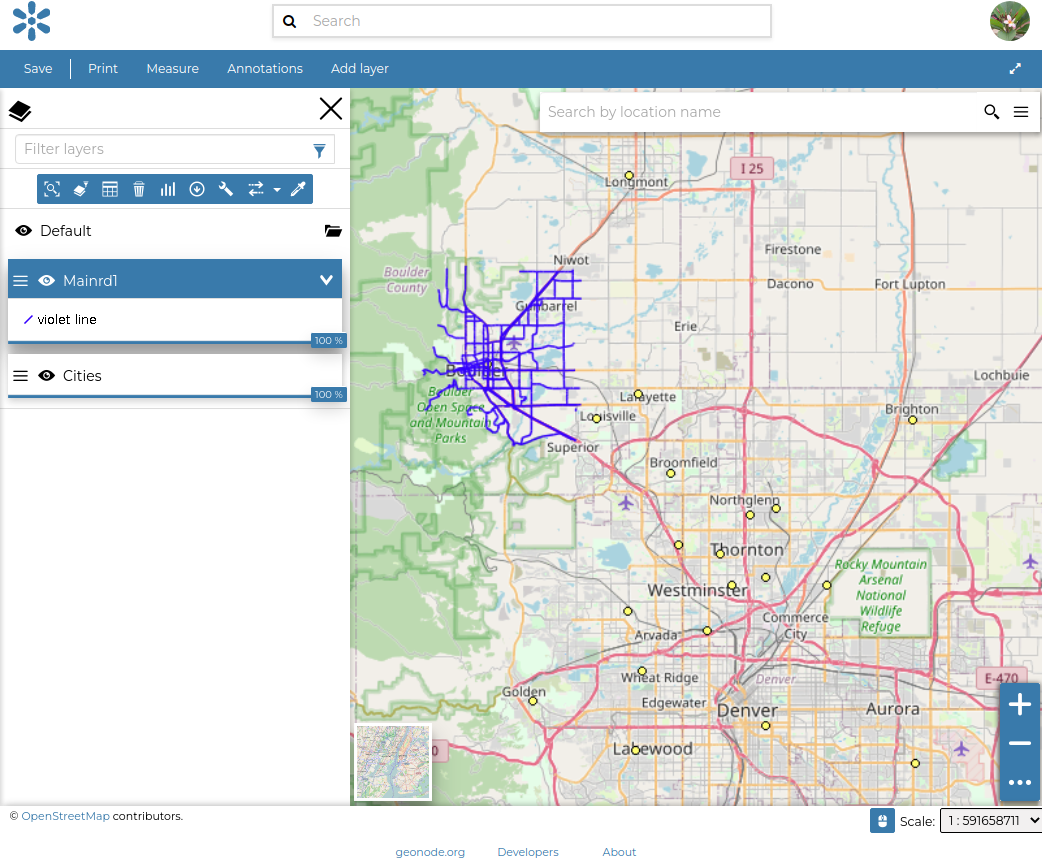
GeoNode will show an empty map with a default background; from the
menuon top, click on theAdd layerbutton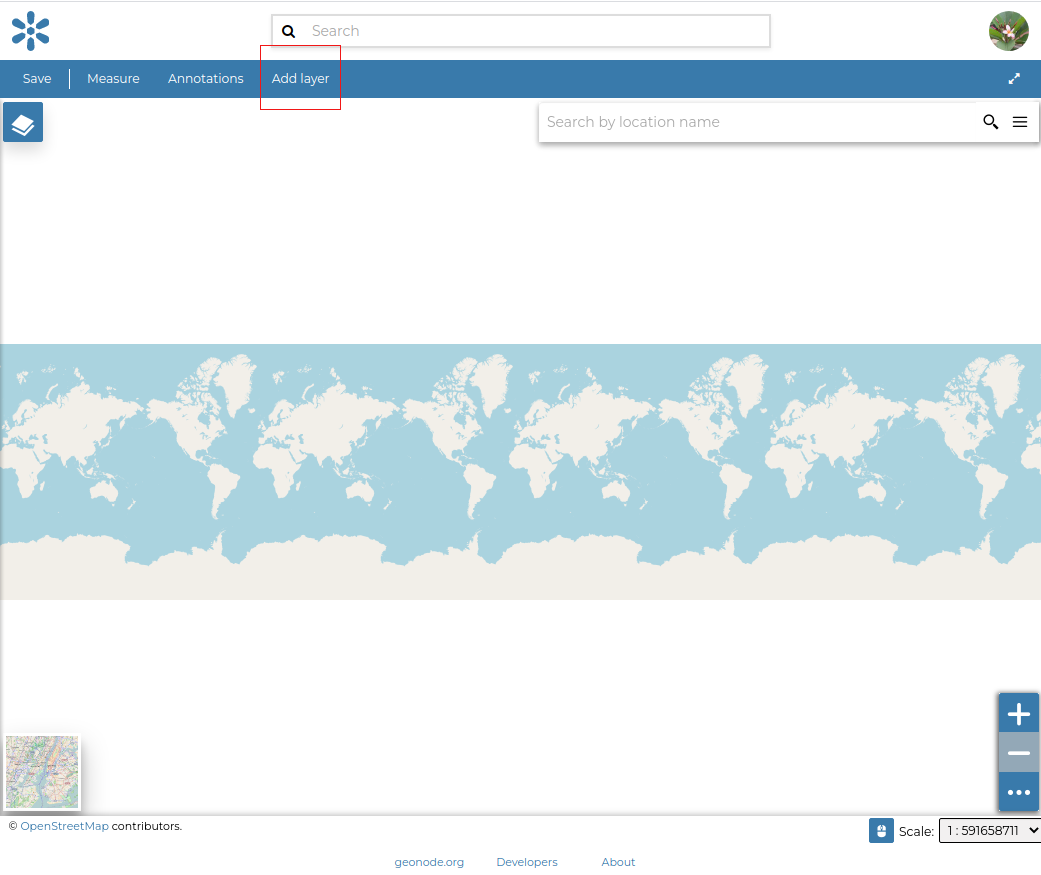
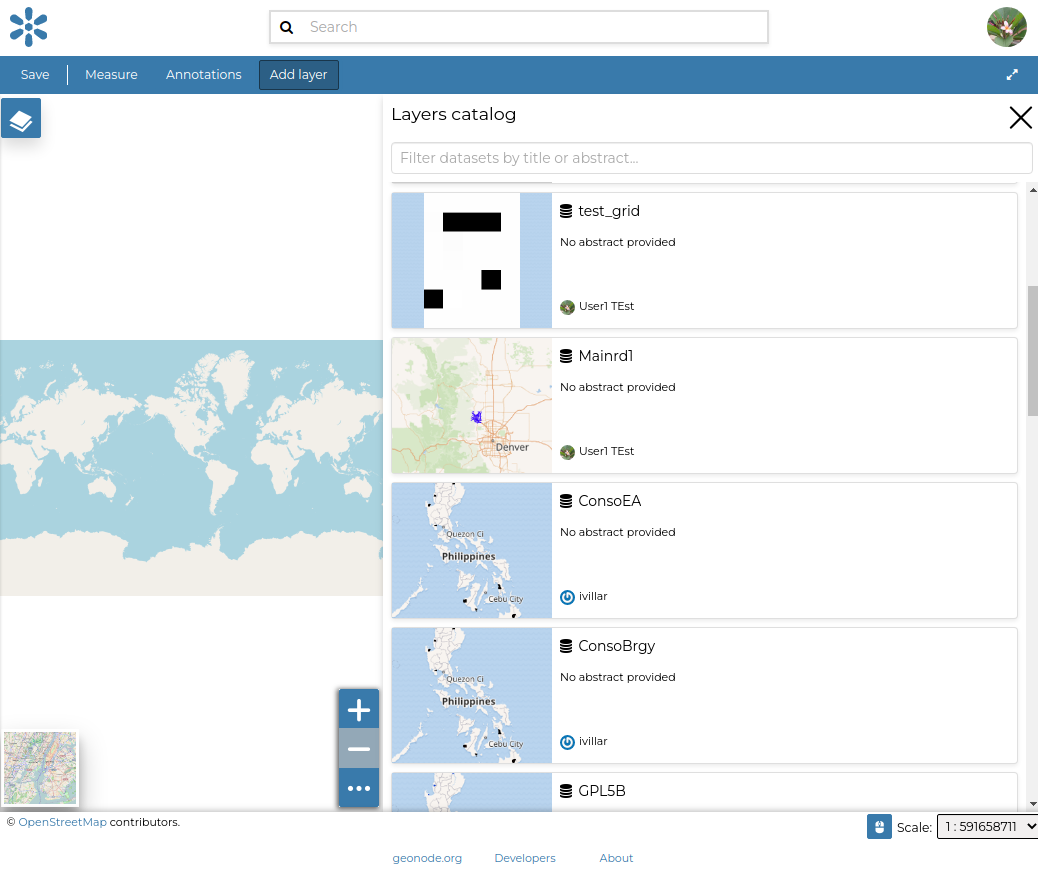
The catalog side menu will appear by showing the available datasets; start adding the overlays by clicking the datasets you want to add.
WARNING: the order of the overlays is important on a map; you can always change the order by dragging the dataset up or down
To view the selected datasets, click on the
layers menuin the top-left corner.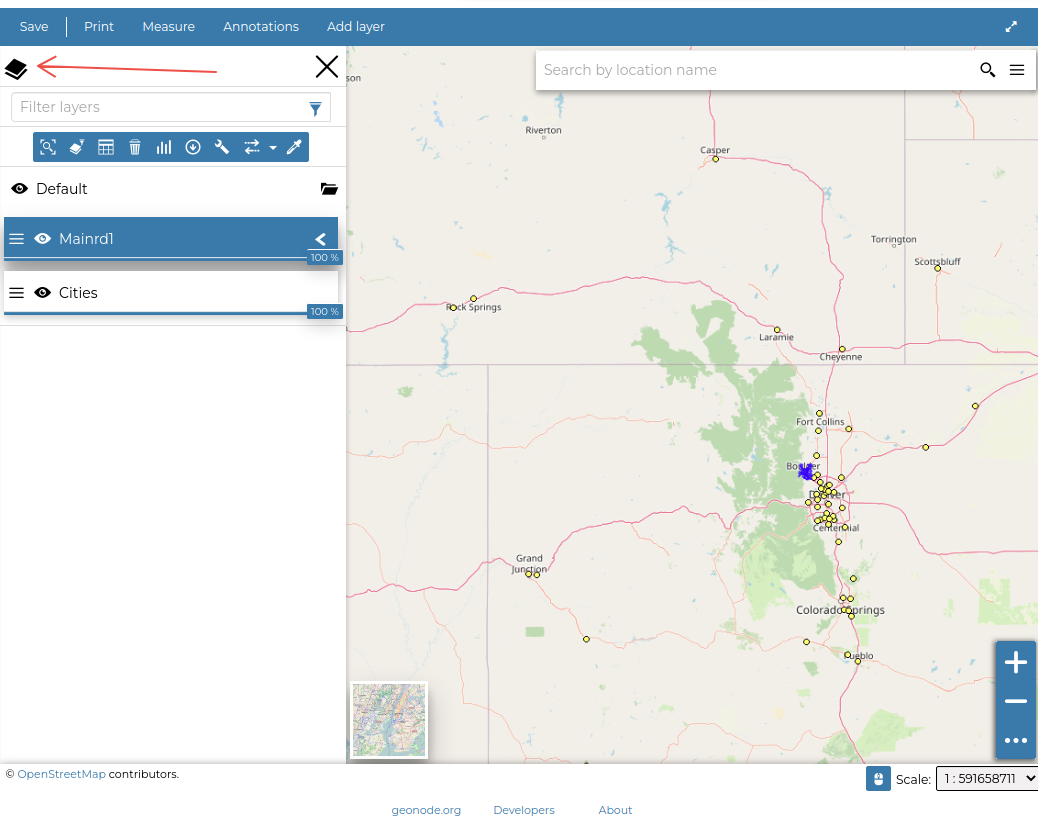
Change the level of detail of the background dataset by zooming in and out to show/hide the dataset details. Change the opacity of the dataset layers by clicking on the slider that says 100% on it and dragging it up and down.
Once happy, click on
Saveat thetop-leftcorner of the menu and selectSave As.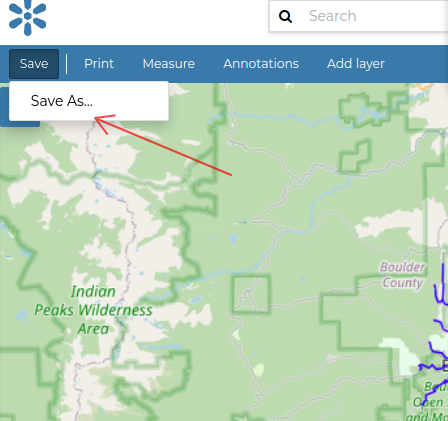
Provide a name and a description and then click on the
Savebutton
If the machine is particularly slow, the save action might display a
timeout error. You can ignore it and go to themaps list. Click onviewthen clickview mapon the newly created map to enter theMap detailspage
Linking a Resource to the Map
From the
Editdropdown menu on theBouldermap detail page, click on theEdit Metadatalink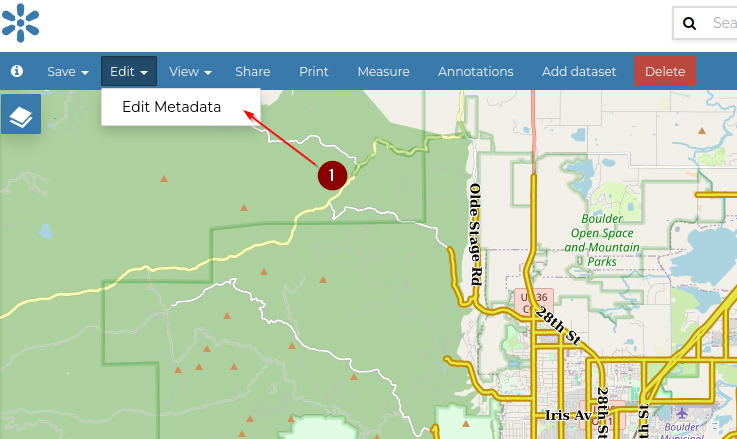
Click on
Optional Metadata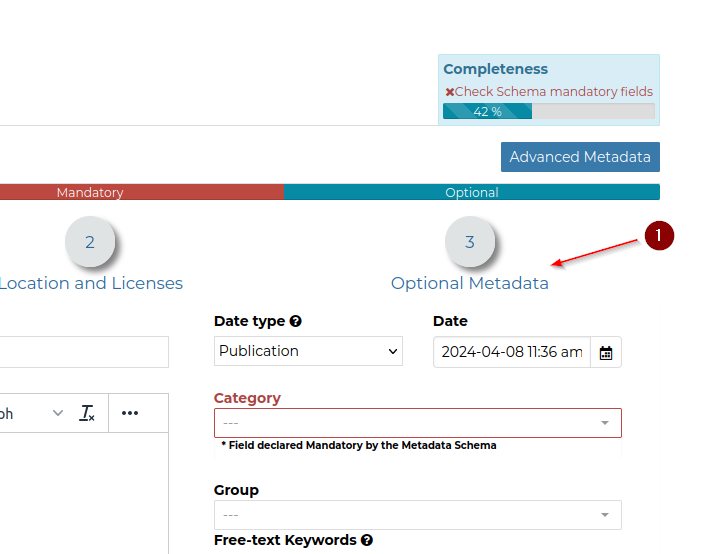
Go to
Resource Links, and selectMainrdform the dropdown box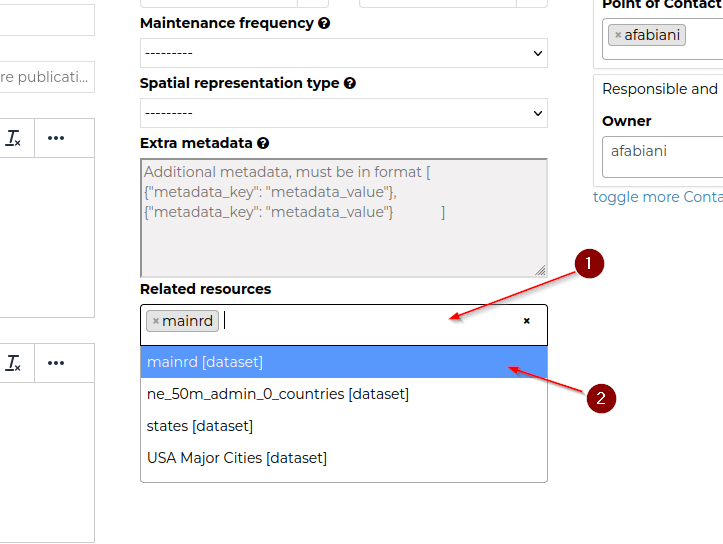
Click on
Updatein order to persiste the changes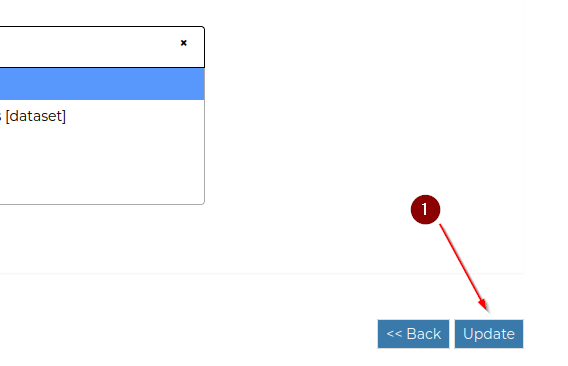
From the
Bouldermap detail page, click on theInfolink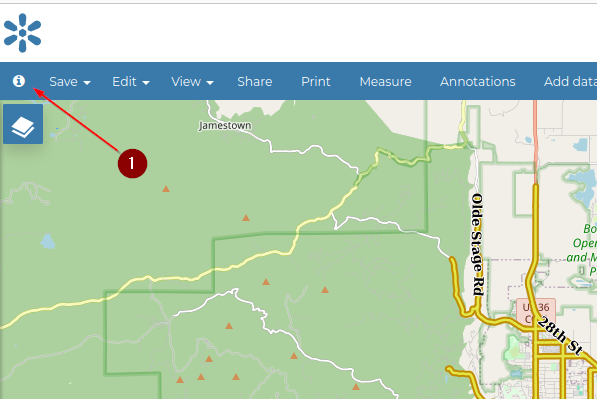
From the
Infopanel, click on theLinked Resourcessection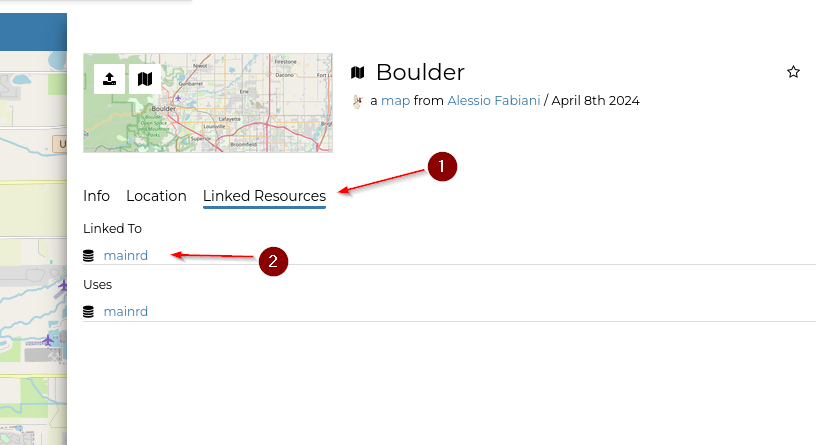
The same procedure can be done for other resources in GeoNode.